Summary
Going to school is critical for our children’s futures. The evidence is clear that every day of school matters, missing school leads to lower achievement. In New Zealand, learners are expected to attend school every day the school is open. And yet many don’t. New Zealand has lower attendance than other countries and alarmingly attendance is falling.
To understand what is happening to attendance in New Zealand, the Education Review Office (ERO) looked at parents’ and learners’ attitudes, choices, and experiences. This report describes what we found and what is needed to improve attendance.
Whole article:
Missing Out: Why Aren’t Our Children Going to School?Executive summary
Going to school is critical for our children’s futures. The evidence is clear that every day of school matters, missing school leads to lower achievement. In New Zealand, learners are expected to attend school every day the school is open. And yet many don’t. New Zealand has lower attendance than other countries and alarmingly attendance is falling.
To understand what is happening to attendance in New Zealand, the Education Review Office (ERO) looked at parents’ and learners’ attitudes, choices, and experiences. This report describes what we found and what is needed to improve attendance.
Attendance is when learners are at school and in the class they are supposed to be at. If learners miss a week or more of school in a term, they have ‘non-regular attendance’. Learners who miss a week each term will have missed out on more than a year of schooling by the time they are 16.
Covid-19 has badly disrupted attendance, but even before the pandemic Aotearoa New Zealand had lower attendance than other countries. And alarmingly attendance is falling – between 2015 and 2019, there was a 12 percentage point decrease in learners who were going to school regularly..
Declining attendance is seen across all school types and for all ethnicities. The drop has been steepest in low-decile schools, and for Māori and Pacific learners. The biggest change has been the increase in learners who no longer go to school regularly but do go to school often (80 to 90 percent of the time). This study looks at why.
This study looked at the views that parents and learners have about education, and about attending school across Aotearoa New Zealand, in English-medium schools.
Why are learners missing school?
1. Many parents and students do not understand the importance of going to school.
Understanding the importance of attendance is critical. We found that:
- four in 10 parents (41 percent) are comfortable with their child missing more than a week of school a term, or almost a year of their schooling by the time they are 16
- a third of learners (33 percent) don’t think going to school every day is that important
- nearly a quarter (22 percent) of students do not think school is that important for their futures.
Parents told us they thought regular attendance was less important in primary school, but this is not the case. Primary school provides foundation learning and missing school in primary school is linked with poor attendance in secondary school.
2. Many parents and students are choosing to prioritise other things.
School needs to be a priority if we are to reverse the decline in attendance. We found that parents often prioritise other things:
- two-thirds of parents (67 percent) would keep their children home for a family, cultural, or special event
- a third of parents (35 percent) would take children out of school for a holiday of a week or more or to participate in a sporting event (41 percent)
- twelve percent would keep children home for their birthday.
Parents of primary aged learners or from rural areas are more likely to support missing school to go on a holiday. Māori (81 percent) and Pacific (71 percent) parents are more likely to keep their child out of school to attended family cultural events.
Learners also miss school due to other priorities. Learners said they want to miss school because they:
- have more enjoyable things to do at home (33 percent)
- have whānau, cultural, or special events during school time (17 percent)
- have responsibilities to look after sick or younger whānau and family members (8 percent).
3. Learners face real barriers to going to school.
To shift attendance, we need to understand and overcome barriers to going to school. The study was during the peak of the Omicron outbreak, so illness and injury was by far the most common barrier to school attendance identified by parents and learners. Seventy-six percent of parents said they had kept their child home in the past term for illness or injury.
We also found that:
- nearly half of parents would keep their child out of school for mental health challenges (46 percent)
- more than a third would keep their child out of school to avoid bullying (38 percent)
- one in 10 would keep their child out of school because the child is tired.
Learners face barriers to school attendance:
- for over a third of learners (35 percent) not liking getting up in the morning/tired was a barrier for them attending school
- for nearly one in five learners (17 percent) not liking at least one of their teachers was a barrier for them attending school
- being bullied or picked on at school (10 percent) and not liking people in their class (15 percent) are also barriers for learners to attend school.
4. Some groups of parents and learners face more barriers than others.
To improve attendance we need to understand the different barriers learners face.
Māori and Pacific parents are more likely to keep their child out of school due to bullying, illness, and mental health challenges.
Older learners (year 11-13) are less engaged in school and more likely to want to miss school because they aren’t interested in what is taught.
Learners in low decile schools are more likely to think it was important to go to school every day. However, parents of learners in low decile schools face more challenges with transport or their children not having all the equipment/resources they need to go to school. While learners in high decile schools have higher attendance, they are less motivated to go to school if they have more enjoyable things to do at home.
Disabled learners have multiple barriers to attendance and stay at home more because they can’t participate in an activity, don’t have the support or equipment to participate, have physical and mental health challenges, are bullied, and face challenges with transport.
Why do learners go to school?
1. Relationships and the future were the biggest motivators for learners to attend school.
By understanding what motivates learners to go to school we can be more effective in raising attendance. The top motivators that make learners want to go to school are:
- getting to see and spend time with friends (80 percent)
- seeing how school will help in their future (54 percent)
- liking at least one of their teachers (41 percent).
2. Different groups of learners have different motivators.
We need to tailor our approaches to different learners. We found that:
- participating in sports and clubs is more motivating for Māori learners, Pacific learners, and learners from low decile schools to attend school
- having an adult they trust is more motivating for primary learners, disabled learners, and learners from low decile schools
- Pacific learners are more motivated to go to school to make their whānau proud of them
- fewer Māori learners and disabled learners are motivated by being able to see the relevance of school to their future.
Learners who told us they had regular attendance are more motivated to go to school because they liked or were interested in what was being taught and could see how school was relevant to their future. Learners who told us they had non-regular attendance are more motivated to go to school because they would get into trouble if they didn’t go.
How can we increase attendance?
Schools cannot improve attendance alone. Urgent action is needed by government, communities, schools, families, and learners to turn around Aotearoa New Zealand’s falling attendance levels. Action is already underway with the Ministry of Education’s Attendance and Engagement strategy, All in for learning |Kia Kotahi te ū ki te ako. Many schools we talked to had also put in place targeted initiatives to raise attendance.
Schools, parents, and learners told us what they thought would help improve attendance. We are recommending action in five key areas.
Area 1: Improve understanding of the importance of regular attendance
- Explain the importance of attendance and the impact of non-attendance
- Set clearer expectations about attendance
- Set expectations (and the support needed) that learners catch up on missed learning
Area 2: Improve awareness of how often learners are attending school
- Understand the attendance of every learner in a school and act early when concerned
- Help parents to better understand their children’s attendance
- Empower learners to better understand how their attendance is tracking
- ERO will review schools attendance monitoring targets
Area 3: Make learning more engaging
- Understand learners’ interests and what at school they find engaging or disengaging
- Review the way in which teaching and learning is organised, drawing on learner’s perspectives
- Help learners to see how subjects are relevant and valuable to them
- Take early action when learners are disengaging from learning and support them to re-engage and catch up
Area 4: Make school a great place to be
- Understand how learners find the school environment and identify issues early
- Use proven tools to tackle bullying, racism, and discrimination
- Provide access to mental health support for those learners who need it
Area 5: Tackle barriers to attendance
- All agencies to work together to tackle the key barriers to attendance (for example, transport and uniform costs)
- Build strong relationships between schools and whānau to identify key barriers to attendance and any action schools can take to overcome them
- Have pathways back into regular attendance for learners who aren’t attending regularly
About this report
Attendance at Aotearoa New Zealand schools has been declining across all demographic groups for several years. This report looks at what is driving the decline in attendance by talking to parents and learners about why learners miss school and why learners go to school. It also suggests how attendance can be improved.
Purpose
This report looks at the views that parents and learners have about school and about attending school across Aotearoa New Zealand, in English-medium schools. It includes strategies to improve regular attendance.
Questions we asked
We looked at the drivers of non-attendance of learners who often attend school, but don’t go all the time. We did not look at the drivers of non-attendance of learners who rarely go to school. We asked:
- What has happened to attendance in Aotearoa New Zealand?
- What does the evidence tell us about the drivers of attendance?
- When and why are learners missing school?
- When and why are learners going to school?
What we did
ERO collected a wide range of data to understand the attitudes and perceptions held by parents and learners about school and school attendance. ERO spoke to learners, parents, teachers, and school leaders to understand what might be contributing to the decline in attendance we are seeing, and to provide ideas for improving attendance.
The data ERO collected included:
- surveys of 2641 Year 4 to 13 learners across Aotearoa New Zealand (this was reduced to 1893 to ensure the sample wasn’t skewed towards some schools - see Appendix 1 for details.)
- surveys of 1133 parents of school-aged children across Aotearoa New Zealand
- six whānau/parent focus groups (37 parents)
- ten learner focus groups (80 learners)
- interviews and focus groups with a total of 41 school leaders and teachers from 33 schools across Aotearoa New Zealand.
Surveys samples were as representative as possible, however the students sample differed from the population on some demographics. Further details on our data collection and analysis are given in Appendix 1.
Report structure
This report sets out what we have found about why learners are and are not going to school in Aotearoa New Zealand.
- Part 1 describes what attendance is and why it is important
- Part 2 sets out what has happened to attendance in Aotearoa New Zealand
- Part 3 describes what we already know about why learners miss or go to school
- Part 4 sets out the reasons we found for when and why learners aren’t attending
- Part 5 sets out the reasons we found for what motivates learners to go to school
- Part 6 reports on our findings for Māori learners
- Part 7 reports on our findings for Pacific learners
- Part 8 describes the different drivers of attendance for different learners
- Part 9 sets out what would help to improve attendance
There are short vignettes (in green boxes) throughout the report which highlight specific experiences of respondents, or actions undertaken by schools.
ERO is very grateful for the time of all those who we spoke to while researching for this report. We would like to thank all the learners, parents and whānau, teachers, and principals for generously sharing their experiences around school attendance.
We would also like to thank our Expert Advisory Group: Professor Melinda Webber and Dr Mohamed Alansari, who shared their knowledge and wisdom.
Part 1: What is attendance and why does it matter?
School attendance is a key priority as attendance at school is critical for achievement, wellbeing, and other lifelong outcomes.
The more days of school a learner misses, the greater the impact on their learning. Establishing healthy attendance patterns early in schooling helps learners carry through attendance habits into future schooling. Missing school for justified reasons is less harmful than missing school for unjustified reasons, but there is no safe level of non-attendance. Every day matters.
This section outlines:
- What attendance is
- Why attendance matters
- When attendance matters
What is attendance?
Attending school is learners being in the classroom when they are expected to be there. In Aotearoa New Zealand, the expectation is that learners will attend every day that a school is open and that schools will take all reasonable steps to ensure they do.1
There are different types of absences from school. Absences are justified if the reason a learner is not at school is an acceptable reason for the learner to be away from school. An example of a justified absence would be a short-term illness. Unjustified absences are those that are either unexplained or are an unacceptable reason. An example of an unjustified absence could be a holiday during term time.2
Regular attendance in Aotearoa New Zealand is defined as missing less than a week (less than 10 half days, or five full days) in a term. Learners who miss a week each term will have missed out on a year of schooling by the time they are 16.
Why does attendance matter?
Attendance is a key driver of learners’ achievement and wellbeing, and their lifelong outcomes.3,4,5
Attendance and achievement
National and international evidence shows that attendance is directly related to how well learners achieve, both in primary and secondary schools.6,7,8,9 The more learners attend, the higher their achievement, and the more NCEA credits they gain.10,11
As the graph below shows, there is no safe level of non-attendance – even missing just two days a term is linked to lower achievement. Missing school leads to lost opportunities to learn that impacts on achievement, even if learners have good engagement.12
For learners in lower decile schools, non-attendance is linked to a loss of learning and a greater risk of not achieving national qualifications.13,14
Worryingly, the impact of missing school builds over time as learners fall further behind their peers.15 Irregular attendance has long-lasting effects on later attainment.
Figure 1: Overall relationship between attendance rate and attainment (NCEA Level 1 credits)
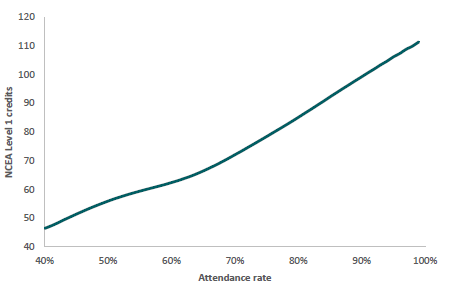
Figure one is a graph showing the overall relationship between learners’ attendance rate and their gained NCEA level one credits.
The gained NCEA level one credits increase steadily when the attendance rate increases.
When the attendance rate is forty percent, the gained NCEA level one credits is nearly fifty.
When the attendance rate is fifty percent, the gained NCEA level one credits is nearly sixty.
When the attendance rate is sixty percent, the gained NCEA level one credits is over sixty.
When the attendance rate is seventy percent, the gained NCEA level one credits is over seventy.
When the attendance rate is eighty percent, the gained NCEA level one credits is about ninety.
When the attendance rate is ninety percent, the gained NCEA level one credits is about a hundred.
When the attendance rate is one hundred percent, the gained NCEA Level one credits is over one hundred and ten.
Source: Ministry of Education
Attendance and wellbeing outcomes
Going to school is important for learners’ wellbeing.16
More days of non-attendance is associated with worse wellbeing outcomes, including schoolwork-related anxiety, decreased sense of belonging, fewer friendships with peers, exposure to bullying, and feeling like your teachers is being unfair.17 The relationship between non-attendance and wellbeing works both ways - poor wellbeing leads to poor attendance, and poor attendance leads to poor wellbeing.
Attendance and lifelong outcomes
Poor attendance increases the risk of poor achievement, which has lifelong negative impacts including lower earnings and employment sustainability.18 International research19 has also linked lower school attendance to:
- increased likelihood of dropping out of school earlier
- social isolation from school community and peers
- poorer mental health and social functioning
- increased likelihood of criminal activity
- increased likelihood of requiring social assistance in the future.
When does attendance matter?
Primary
Establishing regular attendance routines early in children’s schooling is important. How often learners attend in early primary school predicts how much they will attend in secondary school. Non-attendance in early education often continues in later years.20,21,22
Primary school also lays the foundations for future learning and develops the skills that are important for being successful in secondary school. Missing school in primary school can create gaps in learning that set learners back in secondary school and contribute to increasing disengagement from school and learning.23
Absences
How much school is missed matters, but so does the type of absence. Unjustified absences, those absences not agreed with the school, are linked to larger losses in learning than justified absences.24,25
Conclusion
Attendance is critically important for learners to thrive in education. It impacts on how well they achieve and also on their future outcomes. This is why the low and declining attendance rates in Aotearoa New Zealand are so concerning. The next section of this report sets out how attendance in Aotearoa New Zealand compares to other countries, and the nature and size of the decline.
Part 2: What has happened to attendance in Aotearoa New Zealand?
Attendance in Aotearoa New Zealand has been declining since 2015. Lockdowns and the disruptions caused by Covid-19 have further disrupted attendance. This section lays out what has happened to attendance in Aotearoa New Zealand, how it differs across groups, and how Aotearoa New Zealand compares to other countries.
This section outlines:
- How attendance in Aotearoa New Zealand compares to other countries
- How attendance in Aotearoa New Zealand is changing
How does attendance in Aotearoa New Zealand compare to other countries?
Aotearoa New Zealand has lower attendance
Attendance levels in Aotearoa New Zealand sit below attendance levels in other comparable countries. In a comparison conducted by the Ministry of Education, Aotearoa New Zealand attendance was found to be lower than attendance in Australia, Canada, Ireland, the United Kingdom, and the United States.26
Figure 2: International comparison for regular attendance
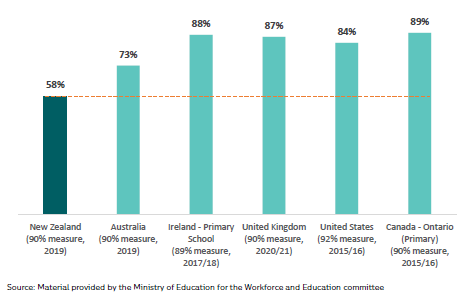
Figure two is a graph comparing the regular attendance rates for New Zealand and other comparable countries including Australia, Ireland, United Kingdom, United States and Canada.
The regular attendance rate for New Zealand was fifty eight percent in two thousand and nineteen.
The rate for Australia was seventy three percent.
The rate for Ireland was eighty eight percent.
The rate for United Kingdom was eighty seven percent.
The rate for United States was eighty four percent.
The rate for Canada was eighty nine percent.
Source: Material provided by the Ministry of Education for the Workforce and Education committee
Compared to the New Zealand measure of 58 percent of learners attending more than 90 percent of available half-days in Terms 1 and 2 2019:
- Australia: 73 percent of learners attended at least 90 percent of available half days in Terms 1 and 2 of 2019.
- Ireland: 88 percent of primary learners attended more than 89 percent of days in 2017/18.
- The United Kingdom: 87 percent attended more than 90 percent of days in 2020/21.
- The United States: 84 percent attended more than 92 percent of days in 2015/16.
- Canada: 89 percent attended more than 90 percent of days in 2015/16.
How has attendance changed?
Attendance is declining
Even before Covid-19 attendance was declining. Attendance is monitored based on attendance in Term 2. Around two-thirds of learners regularly attended school prior to 2015. From 2016 to 2019 there was a decline with regular attendance falling to 58 percent in 2019. Between 2015 and 2019, there was a 12-percentage point decrease in learners who were going to school regularly.
Figure 3: Percentage of learners regularly attending
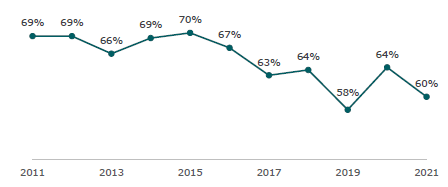
Figure three is a graph showing the percentage of learners who regularly attend school in New Zealand from 2011 to 2021.
The percentage declined from 69% in 2011 to 66% in 2013.
After increasing to 70% in 2015, it dropped to 63% in 2017 and further down to 58% in 2019.
It then went up to 60% in 2021.
Source: Ministry of Education
Attendance data after 2019 was impacted by Covid-19 disruptions. The 2020 attendance data is only reflective of the last seven weeks of Term 2 when learners were able to return to the classroom after a period of remote learning. In 2021, when Aotearoa New Zealand was not in lockdown, regular attendance fell again to 60 percent. It is expected that attendance data for 2022 will show another decline as the Omicron outbreak continued into Term 2.
Irregular attendance is increasing
The biggest change is that learners who once attended regularly, are now have irregular attendance.
Learners who:
- attend more than 80 percent and up to 90 percent have irregular absences
- attend more than 70 percent and up to 80 percent have moderate absences
- attend 70 percent or less of the time have chronic absences.
The increase in irregular absences is very concerning as every day missed impacts on learning.
Figure 4: Percentage of learners in each attendance category between 2015 and 2019
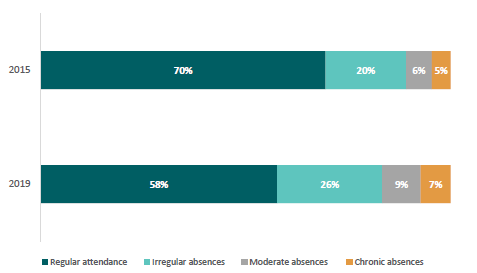
Figure four is a graph showing the percentage of learners in the following four attendance category: regular attendance, irregular attendance, moderate absences, and chronic absences between 2015 and 2019.
In 2015, 70% learners were in regular attendance.
20% learners were in irregular attendance.
6% learners were in moderate absences.
5% learners were in chronic absences.
In 2019, 58% learners were in regular attendance.
26% learners were in irregular attendance.
9% learners were in moderate absences.
7% learners were in chronic absences.
Source: Ministry of Education
Justified and unjustified absences are increasing
Both justified and unjustified absences are increasing. Since 2015, there has been an increase in both types of absences. This is worrying as unjustified absence are shown to impact more on learning.
Figure 5: Types of absences in Aotearoa New Zealand across time
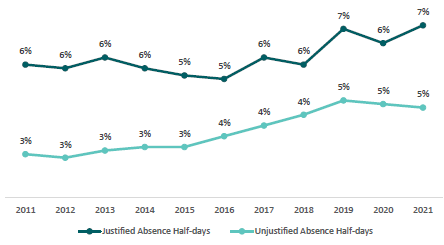
Figure five is a graph showing the percentages of two types of absence: justified absence half days and unjustified absence half days in Aotearoa from 2011 to 2021.
The rate for justified absence half days was around 6% before 2015, and it increased in general since that year and the rate was 7% in 2021.
The rate for unjustified absence half days were around 3% before 2015, and it continuously went up since that year till 5% in 2019 and the rate were remained almost the same in 2020 and 2021.
Source: Ministry of Education
Schools in poorer communities have seen a bigger decline
The decline in regular attendance from 2015 onwards is steeper for low decile schools. Our research on the impacts of Covid-19 also found that low decile schools were most impacted by Covid-19, which may affect ongoing attendance.28
Figure 6: Regular attendance by decile across time (2011-2021)
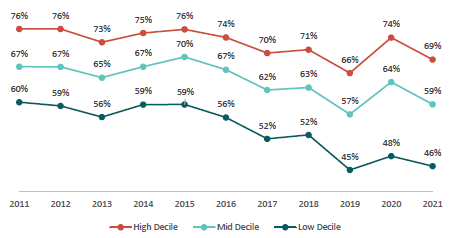
Figure six is a graph showing the regular attendance rates by decile groups from 2011 to 2021.
The rate for high decile schools experienced small fluctuations between 73% and 76% from 2011 to 2015. It then experienced an overall decrease from 2015(76%) to 2019(66%). It jumped to 74% in 2020 before it dropped to 69% in 2021.
The rate for mid decile schools experienced small fluctuations between 65% and 70% from 2011 to 2015. It then experienced an overall decrease from 2015(70%) to 2019(57%). It jumped to 64% in 2020 before it dropped to 59% in 2021.
The rate for low decile schools experienced small fluctuations between 59% and 60% from 2011 to 2015.
It then experienced an overall decrease from 2015(59%) to 2019(45%). It increased to 48% in 2020 before it dopped to 46% in 2021.
Source: Ministry of Education
Māori and Pacific learners have seen a bigger decline
The decline in attendance since 2015 has existed for learners of all ethnicities. However, the decline has been more pronounced for Māori and Pacific learners. The drop in regular attendance rate from 2015 to 2019 was 16 percentage-points for Pacific learners, 13 percentage-points for Māori learners, 11 percentage-points for Pākehā, and 11 percentage-points for Asian learners.
Figure 7: Regular attendance by ethnicity across time (2011-2021)
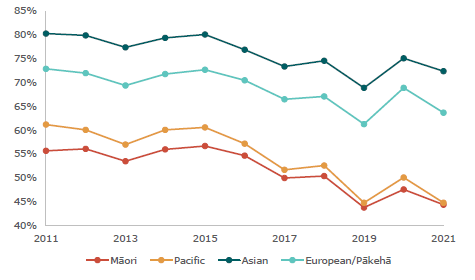
Figure seven is a graph showing the regular attendance rates for the following four ethnic groups: Māori, Pacific people, Asian and European/Pākehā from 2011 to 2021.
The rate for Asian experienced small fluctuations between 77% and 80% from 2011 to 2015. It then experienced an overall decrease from 2015(80%) to 2019(69%). It jumped to 75% in 2020 before it dropped to 72% in 2021.
The rate for European experienced small fluctuations between 69% and 73% from 2011 to 2015. It then experienced an overall decrease from 2015(73%) to 2019(61%). It jumped to 69% in 2020 before it dropped to 645 in 2021.
The rate for Pacific people experienced small fluctuations between 57% and 61% from 2011 to 2015. It then experienced an overall decrease from 2015(61%) to 2019(45%). The rate jumped to 50% in 2020 before it dropped to 45% in 2021.
The rate for Māori experienced small fluctuations between 54% and 57% from 2011 to 2015. It then experienced an overall decrease from 2015(57%) to 2019(44%). The rate jumped to 48% in 2020 before it dropped to 44% in 2021.
Both primary and Secondary schools have seen a decline
Attendance at primary school is consistently higher than attendance at secondary or composite schools. The decline in regular attendance is seen at all levels and types of schooling, but is greater in secondary schooling.
Figure 8: Regular attendance by school type across time (2011-2021)
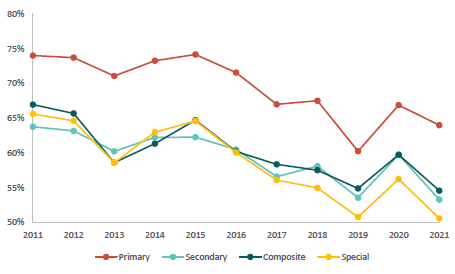
Figure eight is a graph showing the regular attendance rates for the following four type of schools: primary, secondary, composite and special.
The rate for Primary schools experienced small fluctuations between 71% and 74% from 2011 to 2015. It then experienced an overall decrease from 2015(74%) to 2019(60%). It jumped to 67% in 2020 before it dropped to 64% in 2021.
The rate for Secondary schools experienced small fluctuations between 60% and 64% from 2011 to 2015. It then experienced an overall decrease from 2015(62%) to 2019(54%). It jumped to 60% in 2020 before it dropped to 53% in 2021.
The rate for Composite schools experienced small fluctuations between 59% and 67% from 2011 to 2015. It then experienced an overall decrease from 2015(65%) to 2019(55%). It jumped to 60% in 2020 before it dropped to 55% in 2021.
The rate for Special schools experienced small fluctuations between 59% and 66% from 2011 to 2015. It then experienced an overall decrease from 2015(65%) to 2019(51%). It jumped to 56% in 2020 before it dropped to 51% in 2021.
Source: Ministry of Education
Conclusion
Aotearoa New Zealand has worse attendance than other comparable countries, including even our closest neighbour Australia. We have seen a decline in attendance, starting in 2015, and it appears to be declining still. Learners of different ethnicities, ages, and from different school deciles have all seen a decline in attendance.
Part 3: What does the evidence tell us about the drivers of attendance?
Learner, family, school, community, and economic factors all impact on attendance. Understanding how these factors combine and interact is critical to understanding what drives attendance and how best to work with learners, whānau, and communities to improve attendance rates.
This section briefly sets out the range of factors that impact on school attendance.
We have seen that attendance in Aotearoa New Zealand is declining. To understand why, we looked at what international and national evidence says impacts learner attendance at school.29,30,31,32 Attendance and non-attendance are influenced by:
- Learner factors
- Family factors
- School factors
- Community and economic factors
1. Learner factors
Learner factors that impact on attendance or non-attendance include:
- degree to which basic needs are being met
- physical and mental health (including alcohol and drug use)
- sense that school and education is useful for the present and the future
- feeling safe at school
- quality of relationships with teachers and peers
- feeling successful as a learner.
For example, in Aotearoa New Zealand, learners with emotional and behavioural challenges were found to be up to seven times more likely to have unjustified absences from school than those with low to moderate challenges. Emotional and behavioural challenges in a school are more closely associated with truancy levels than school type, size, and decile.33
Aotearoa New Zealand’s high rates of mental illness in young people may impact on attendance. Aotearoa New Zealand has a high and rising rate of mental health issues amongst young people. Our male youth suicide rate was the third highest and female youth suicide rate was the highest in the OECD.
2. Family factors
There are also family factors that impact on attendance, including:
- the family’s relationship with the school (including attitude toward education, sense of connection with the school, and feeling that the school respects the culture of the family)
- sense that school and education is useful for the present and the future
- support for participation and learning – supporting homework and academic progress, supervising and monitoring attendance
- stability and harmony at home
- economic factors such as stability of employment, housing, and affordable transport.
In Aotearoa New Zealand, research34 has found that family function (including disadvantage, dysfunction, or conflictual home environments) is the strongest predictor of later school truancy.
Falling attendance may also reflect families struggling to manage:
- costs of living35 which are increasing in the wake of the global Covid-19 pandemic
- rising costs of accommodation – especially for low-income households36
- increasing work intensity for parents – with an increasing proportion of two parent families where both parents are in full or part-time work.37
About 11 percent of Aotearoa New Zealand families experience material hardship. While the proportion of families with children experiencing material hardship in Aotearoa New Zealand has been steadily trending down since 2013,38 single parent families, families with three or more children, Māori, and Pacific families still disproportionately experience material hardship.39
3. School factors
The school and the environment of the school both impact on attendance, including:
- academic environment (curriculum, teaching practice, teacher expectations, orderliness)
- social environment (quality of relationships with teachers and peers, tolerance for bullying, inclusiveness)
- physical environment (resources for teaching and learning, access to technology, appropriate lighting, heating, and ventilation).
A school’s climate, whether learners get on well, has been found to have the greatest impact on attendance.40
The degree to which teaching responds to individual needs of learners is also identified as an important school factor.41,42
Racism in the education sector has a negative impact on engagement (including attendance) wellbeing, and achievement of Māori and Pacific learners.43,44,45,46,47,48,49
Finally, bullying is a serious issue in Aotearoa New Zealand schools. In 2019, ERO found that 46 percent of primary-age students and 31 percent of secondary-age students reported having been bullied at their current school.50 Aotearoa New Zealand has one of the highest rates of bullying in the OECD.51,52
4. Community and economic factors
The community can also impact on learner attendance. Community barriers, include:
- geographic remoteness
- access to transportation
- employment opportunities and conditions
- availability and affordability of housing.
There are also other community cultural activities and responsibilities that can take priority over going to school, for example attending local marae, tangihanga/funerals, and going to church.
Economic factors that may impact on attendance include:
- low unemployment rates and high youth employment rates – this makes work an increasing option for school aged young people53,54
- a relatively low earnings premium for education (the difference in earnings for different levels of education) compared to other OECD countries – this may make work an increasingly attractive option compared to education.55
Conclusion
The drivers of attendance are complex. Learner attendance on any given day of school will result from the combination of any number of these factors. In the next section of this report, we will set out what learners and parents told us about reasons for missing school.
Part 4: When and why are learners missing school?
Understanding when and why learners are not going to school will help raise attendance.
We found many reasons why learners are missing school. Concerningly, some parents and learners told us that they do not see school as that important.
Many parents and learners, while valuing schooling and attendance, still prioritise other activities over attendance. There are also barriers to attendance.
We have seen that attendance in Aotearoa New Zealand is declining and a range of learner, family, community, and economic factors can impact on attendance. This section of the report outlines the range of factors we found that impacted on attendance.
- The importance parents and learners place on school
- The importance parents and learners place on school attendance
- Activities that parents and learners prioritise over school
- Barriers to attendance
1. Importance of school
Achievement at school leads to positive lifelong outcomes. This section reports on:
- Parents’ views on the importance of school
- Learners’ views on the importance of school
One in 10 parents do not see school as that important
While most parents do value school and think it is important for their child, 8 percent of parents reported that school was only somewhat important, not that important, or not important at all for their child’s future.
Figure 9: Extent to which parents think school is important for their child’s future
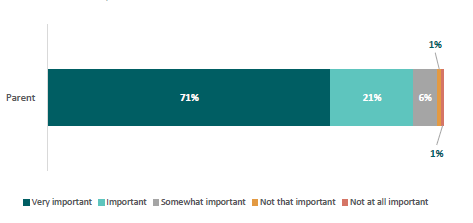
Figure nine is a graph showing the extent to which parents think school is important for their child’s future.
71% parents reported very important.
21% parents reported important.
6% parents reported somewhat important.
1% parents reported not that important.
1% parents reported not at all important.
In focus groups, we heard a similar story. Most parents indicated they felt school was important for their child, but there was still a small number of parents who indicated school was not as important to them. Parents who didn’t value school as highly had a variety of reasons for doing so.
“For our eldest – not so much – she’s not going to be a doctor or lawyer – she is a sports person. Her attendance is shocking because she is travelling so much.’’ - Parent of secondary learner
Nearly a quarter of learners do not see school as that important
We found an even larger proportion of learners do not value school or see it as that important. In our survey, 22 percent of learners said schools was only somewhat important, not that important, or not at all important for their future.
In focus groups with learners, most but not all learners thought school was important.
“No – there are other pathways to success’’ – Learner
“It’s not important to come everyday because a lot of the stuff we’re taught at school isn’t useful for real life’’ - Learner
With school being proven to play such a crucial role in educating learners and preparing them for the future, it is concerning to see so many parents and learners not identifying school as important.
Figure 10: Extent to which learners think school is important for their future
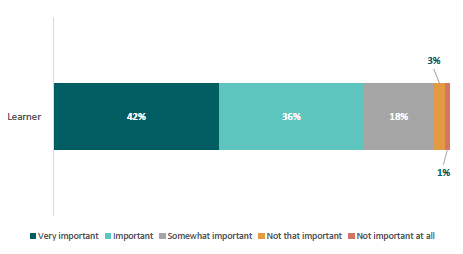
Figure ten is a graph showing the extent to which learners think school is important for their future.
42% learners reported very important.
36% learners reported important.
18% learners reported somewhat important.
3% learners reported not that important.
1% learners reported not at all important.
2. Importance of attendance
There is a strong relationship between attending school and achieving at school. This section reports on:
- Parents’ views on the importance of attendance
- Learners’ views on the importance of attendance
One in 10 parents do not see attendance as that important
Most parents value regular school attendance, but a small but significant group do not recognise the value of attending school regularly. In our survey, we found 8 percent of parents thought attending school every day was either somewhat important, not that important, or not important at all. Parents who did not think school was important for their child’s future also did not think attending school every day was important.
Figure 11: Extent to which parents think going to school every day is important for their child
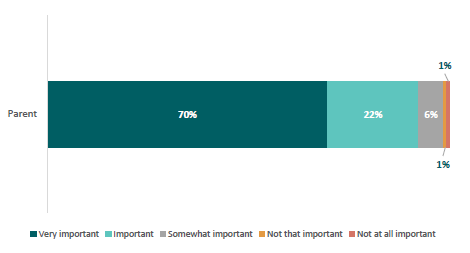
Figure eleven is a graph showing the extent to which parents think going to school every day is important for their child.
70% parents reported very important.
22% parents reported important.
6% parents reported somewhat important.
1% parents reported not that important.
1% parents reported not at all important.
In focus groups we heard a similar story. Most parents said attendance was important for their child, but there was still a small number of parents who said it was not important to them. Some parents in our focus groups said they thought that regular attendance was more important in secondary school when the learning was harder and linked to national assessments.
“At primary school, I would take children out of school for life experiences. Once at high school, attendance is more important. They are learning about schedules, time keeping, social skills. They need commitment and thinking ahead about pathways.”- Parent
“In primary it is important to attend but not crucial. From Year 9 and up it is more and more important. Should be treated like a job, school isn’t always amazing or not boring but you need to go and build the habit.” - Parent
Similarly, recent Ministry of Education research on perceptions of attendance showed that respondents were less likely to identify attendance as an issue in primary schools (20 percent of respondents in this study thought attendance was an issue in primary schools versus secondary schools; conversely 40 percent thought it was an issue in secondary schools).56
Many parents are comfortable with their child missing school. Across all the parents:
- three out of 10 (29 percent) are comfortable with their child missing between one and two weeks a term
- more than one in 10 (12 percent) are comfortable with their child missing more than two weeks of school a term.
Figure 12: Amount of school across a term parents feel comfortable with their child missing
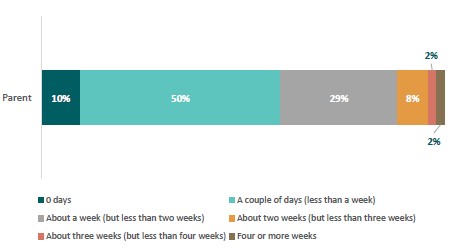
Figure twelve is a graph showing the amount of school across a term parents feel comfortable with their child missing.
10% parents reported 0 days.
50% parents reported a couple of days (less than a week).
29% parents reported about a week, but less than two weeks.
8% parents reported about two weeks, but less than three weeks.
2% parents reported about three weeks, but less than four weeks.
2% parents reported four or more weeks.
School teachers and leaders that we interviewed noticed that some parents appear to be more comfortable than they used to be with school absences following Covid-19.
“Families maybe feeling better about keeping kids home because they are more familiar with online learning and resources and more at ease supporting children at home” - Teacher
A third of learners do not see attendance as that important
Compared to parents, even fewer learners see regular school attendance as important. A third (33 percent) of learners think attending school every day was either somewhat important, not that important, or not important at all.
In focus groups with learners, there were some learners who didn’t think attending regularly was important.
“No, not important, one day absent a week isn’t going to do anything to ‘my learning’”- Learner
“It’s not important to come every day because a lot of the stuff we learn at school isn’t useful for real life – for example getting a job; for example algebra, pythagoras”- Learner
Figure 13: Extent to which learners think going to school every day is important
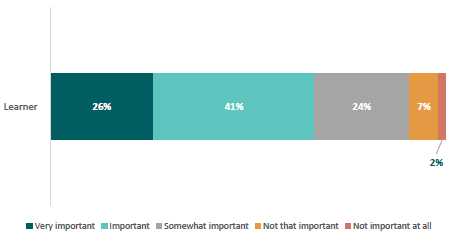
Figure thirteen is a graph showing the extent to which learners think going to school every day is important.
26% learners reported very important.
41% learners reported important.
24% learners reported somewhat important.
7% learners reported not that important.
2% learners reported not at all important.
One in five learners (19 percent) are not too worried (not at all worried or not that worried) about catching up after missing one week of school.
Figure14: Extent to which learners feel worried about catching up on schoolwork after missing one week of school
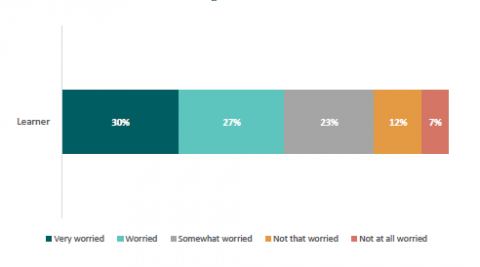
Figure fourteen is a graph showing the extent to which learners feel worried about catching up on schoolwork after missing one week of school.
30% reported very worried.
27% reported worried.
23% reported somewhat worried.
12% reported not that worried.
7% reported not at all worried.
Learners do not see the value of attending five days a week of school. Less than half of learners (42 percent) would choose to go to school five days a week if they could choose. Just under a third (29 percent) would want to go four days a week and the remaining (29 percent) would want to attend three days or less.
Figure15: Number of days learners would go to school if it was only up to them to choose
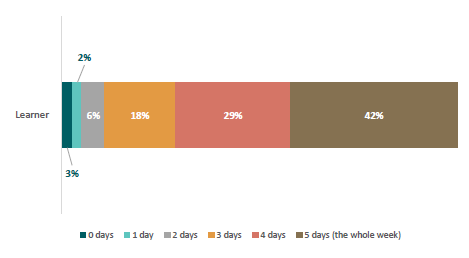
Figure fifteen is a graph showing the number of days learners would go to school if it was only up to them to choose.
3% reported zero days.
2% reported 1 day.
6% reported 2 days.
18% reported 3 days.
29% reported 4 days.
42% reported 5 days, the whole week.
While many parents and learners do value regular school attendance and think going to school is important, there remain too many who don’t. With such clear evidence that every day of attendance matters for learner outcomes, it is worrying that so many parents and learners do not see its importance.
3. Prioritising school
Missing school is sometimes driven by prioritising other activities.
This section reports on parents’ and learners’ attitudes towards missing school in favour of the following priorities (in order of importance):
- Family or special events
- Holidays
- Sporting or cultural events
- Enjoyable things happening at home
- Caring or working responsibilities
a) Family or special events
We found that two thirds of parents (67 percent) are likely or very likely not to send their child to school if there were whānau/family/cultural or special events such as funeral, tangihanga, or weddings during school time. In Term 2 8 percent of parents identified whānau/family/cultural or special events such as funeral, tangihanga, or weddings as a reason for why they had kept their child out of school.
In our focus groups we heard parents talk about the importance to them of their children participating in family and cultural events and how this contributes to identity and belonging. We heard that this is a key reason to keep their children out of school.
“Definitely funerals – and with our funerals they can sometimes be two weeks long – it is important that they are learning about culture, cultural practices and family duties. I make sure they get involved in that.” – Pacific parent
“A really special occasion, like a family event is more important to me than missing one day of school. But it would have to be really special.” – Parent
Figure 16: Likelihood of parents keeping their child out of school for a ‘whānau/family/cultural or special event such as Funeral, Tangihanga, Wedding’
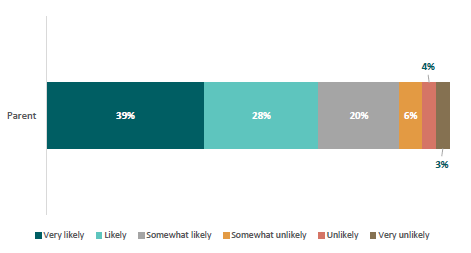
Figure sixteen is a graph showing the Likelihood of parents keeping their child out of school for a ‘whānau/family/cultural or special event such as Funeral, Tangihanga, Wedding’.
39% reported very likely.
28% reported likely.
20% reported somewhat likely.
6% reported somewhat unlikely.
4% reported unlikely.
3% reported very unlikely.
Learners are less likely than parents to prioritise family and cultural events - only two out of 10 learners (17 percent) indicated that having a whānau/family/cultural/special event on during school time (for example, birthday, funeral, tangihanga, weddings) made them want to miss school. Ten percent of learners had missed school in the last term for a whānau/family event (for example, birthday, funeral, tangihanga).
We heard in the learner focus groups that family events sometimes got in the way of learners coming to school. This included things such as spending time with family visitors.
“Family visitors- spending time with them” – Learner
b) Family holidays
Family holidays are a key reason learners miss school. Nearly half of parents (46 percent) are likely or very likely to keep their child out of school to go on a short family holiday for one to two days and just over a third of parents (35 percent) are likely or very likely to keep their child out of school to go on holiday for one or more weeks. Nearly one out of 10 learners (9 percent) reported missing school in the last two weeks for a holiday.
In the focus groups, parents gave a variety of reasons for taking holidays in the school term including overseas family reunification after Covid-19, cost of travel during school holidays, and the view that travel was a learning experience.
“A time we don’t send them to school – is when we go away on holiday because it is very expensive to go in school holidays. So we choose to go before” – Parent
“Holidays- I don’t hesitate booking a holiday during the term time. I don’t have an issue pulling them out. What they would gain from an overseas trip- learning experiences” – Parent
“Parents take you out for family trips” – Learner
Figure 17: Likelihood of parents keeping their child out of school for a ‘whānau/family holiday for one or two days’
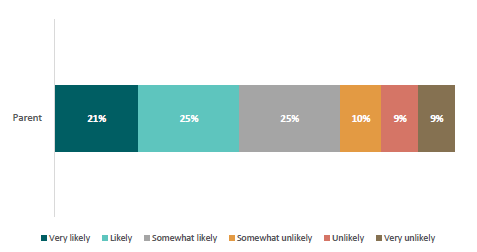
Figure seventeen is a graph showing the likelihood of parents keeping their child out of school for a ‘whānau/family holiday for one or two days’.
21% reported very likely.
25% reported likely.
25% reported somewhat likely.
10% reported somewhat unlikely.
9% reported unlikely.
9% reported very unlikely.
c) Sporting or cultural events
Four out of 10 parents (41 percent) are likely or very likely to not send their child to school if they are participating in an out-of-school sports event. Our survey showed that 7 percent of learners had missed school in the last two weeks because they were doing another activity (cultural or sporting).
This also came up in the focus groups with parents.
“Sporting events- representing the school” – Parent
“Attending dancing exams, speech & drama exams” – Parent
Figure 18: Likelihood of parents keeping their child out of school for ‘child participating in an out-of-school sporting event’
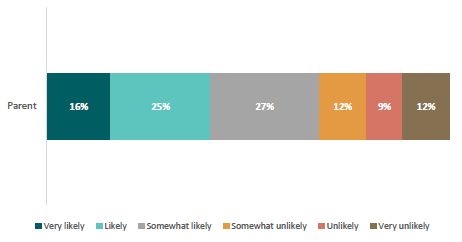
Figure eighteen is a graph showing the likelihood of parents keeping their child out of school for ‘child participating in an out-of-school sporting event’.
16% reported very likely.
25% reported likely.
27% reported somewhat likely.
12% reported somewhat unlikely.
9% reported unlikely.
12% reported very unlikely.
d) Enjoyable things happening at home
Over one in 10 parents (12 percent) are likely or very likely to not send their child to school on their birthday.
Birthdays also came up in the focus groups with parents as reasons for why parents let their children stay home, along with other more enjoyable things happening at home.
“Birthdays- especially when they were younger- when I was a stay at home mum” - Parent
“If there is something awesome happening at the farm.” – Parent
“Something fun on at home, something more interesting not at school.” – Parent
Figure 19: Likelihood of parents keeping their child out of school for ‘child’s birthday’

Figure nineteen is a graph showing the likelihood of parent keeping their child out of school for ‘child’s birthday’.
5% reported very likely.
7% reported likely.
11% reported somewhat likely.
14% reported somewhat unlikely.
20% reported unlikely.
42% reported very unlikely.
For a third of learners (33 percent), having something more enjoyable to do at home makes them want to miss school.
“They'd rather be at home chilling than being at school learning” – Learner
e) Caring or working responsibilities
Caring responsibilities
Some learners do not go to school as they need to look after family members. Just under one in 10 parents (7 percent) are likely or very likely to keep their child out of school if they needed to look after another whānau/family member. However, only 1 percent of parents had kept their child home in the last term for this reason.
“To help family if there are no other people available” – Parent
Just under one in 10 learners (8 percent) identified looking after sick relatives as something that would make them want to miss school. We also heard that 7 percent of learners had missed school in the last two weeks because they had visited or looked after a sick family member.
“Because they have to look after their brothers and sisters” – Learner
Learners in the focus groups said babysitting was a reason for not being able to attend school. Schools also identified looking after family members as something that impacts on learners’ ability to attend school.
“Girls staying home to look after younger children and learners working and picking up odd hours when they should be at school” – School leader
Figure 20: Likelihood of parents keeping their child out of school for ‘child looking after another whānau/family member(s)’
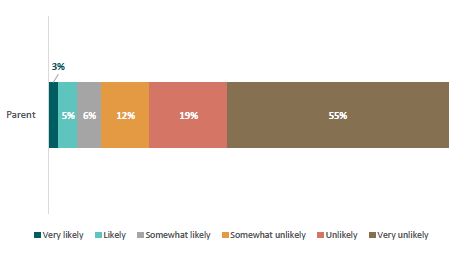
Figure twenty is a graph showing the likelihood of parents keeping their child out of school for ‘child looking after another whānau/family member(s)’.
3% reported very likely.
5% reported likely.
6% reported somewhat likely.
12% reported somewhat unlikely.
19% reported unlikely.
55% reported very unlikely.
Paid work
Work is another reason learners miss school. Almost one in 10 parents (7 percent) are likely or very likely to not send their child to school if their child works a paid job.
In the focus group we heard that parents sometimes kept their children home to help with things that needed doing.
“When we need a hand on the farm” – Parent.
We also heard some parents had supported their child to miss school if their child’s paid job was short staffed and needed their child to work.
“[Child] works some part time jobs. On quiet days at school, she will work a job that is short staffed, but only if she is up to date with schoolwork”- Parent
Learners are less keen to miss school to work. Only 1 percent of learners identified working a job during school hours was something that would make them want to miss school, but 3 percent had missed school to work in the last two weeks.
The theme of working paid jobs came through in the learner focus groups as well, both as a competing priority in deciding to go to school and the impact that working out of school hours has on energy levels at school.
“After lockdown found it hard to return because I wanted to make money’’ Learner
“Working late on a Sunday night’’ – Learner
Just over one in four schools reported more senior learners working paid jobs and leaving school for work.
“A number are picking up paid work, working through the night – when it comes to coming to school – too tired; across Yr 12s also. Kids are saying I need to work because my family needs the money – used to be because they want extra money.” – Teacher
4. Barriers to attendance
There a number of learner, family, school, and community barriers to attendance. Parents and learners told us about some of the barriers they faced which interfered with attending school.
This section reports on the main identified barriers (in order of importance):
- Physical health (including Covid-19 and related anxieties)
- Mental health
- Bullying and other friend-related issues
- Certain school activities
- Lack of engagement with school
- Lack of sleep
- Transport
- Hardship
a) Physical health (including Covid-19 and related anxieties)
Two-thirds of parents identified health as a barrier to attending
Two thirds of parents are likely or very likely not to send their child to school if they had either a minor (67 percent) or chronic illness/injury (63 percent). In Term 2, 2022, 76 percent of parents had kept their child home for a minor illness and 11 percent of parents had kept their child home for chronic illness/injury.
Figure 21: Likelihood of parents keeping their child out of school for ‘child having a minor illness or injury’
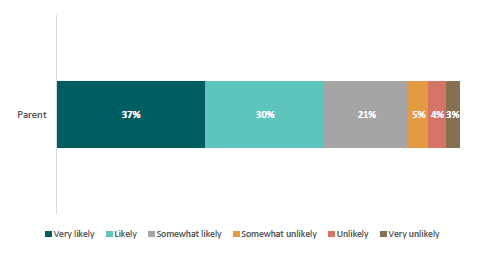
Figure twenty-one is a graph showing the likelihood of parents keeping their child out of school for ‘child having a minor illness or injury’.
37% reported very likely.
30% reported likely.
21% reported somewhat likely.
5% reported somewhat unlikely.
4% reported unlikely.
3% reported very unlikely.
In parent focus groups, health and medical reasons, including mental health, are the most prevalent reason for not sending their child to school.
“Go to school no matter what, unless illness including mental health. There is lots of pressures these days” – Parent
“Covid Symptoms, to prevent her going to school and being sent home this would then take me out of work to go and collect her so easier not to send when symptoms are showing (cough, runny nose etc)” – Parent
The schools we spoke to had noticed parents are more inclined to keep their children home for sickness.
“In last few years - extra caution - keeping home. Staying home for milder illnesses; staying home for longer periods. We used to have a guide - if child sick keep home for 48 hrs - now keeping home for an extra few days - just in case - and to avoid other circulating bugs” – School leader
Over half of learners identified physical health as a major barrier
Our survey found that over half (55 percent) of learners identified being sick as a reason they had missed school in the last two weeks.
“Most get sick due to the fact covid is coming back into action taking away the tamariki from learning” – Learner
Nearly three quarters of the schools we talked to reported they had seen increased absences for sickness. Just over half of schools are seeing longer absences for sickness.
Figure 22: Percentage of learners identifying health-related reasons for not going to school in the last two weeks
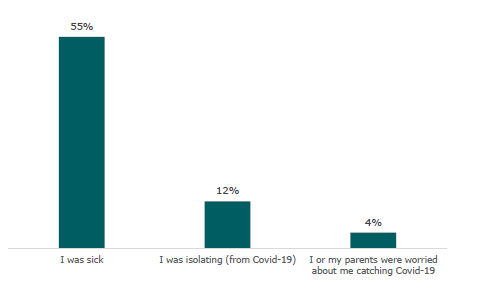
Figure twenty-two is a graph showing the percentage of learners identifying the following three health-related reasons for not going to school in the last two weeks.
55% reported ‘I was sick’.
12% reported ‘I was isolated from Covid-9’.
4% reported ‘I or my parents were worried about me catching Covid-19.’
|
Covid-19 We found that for more than one in seven learners (14 percent) being worried about catching Covid-19 made them want to miss school and 4 percent of learners had missed school in the last two weeks for this reason. About one in 10 learners (12 percent) had missed school in the last two weeks because they were isolating from Covid-19 weeks. Younger learners are more likely to report that they want to miss school because they are worried about catching Covid-19 (24 percent Year 4 to 6, 8 percent Year 11 to 13). Learners from low decile schools are also more likely to want to miss school because they are worried about catching Covid-19 (21 percent low decile, 12 percent high decile). |
b) Mental health
Aotearoa New Zealand has high rates of youth mental illness, which can be a barrier to attendance.
Nearly half of parents identified mental health as a barrier to attending
Nearly half of parents (46 percent) are likely or very likely to keep their child out of school if they have mental health challenges. Eleven percent had kept their child home for mental health in the last term.
“My child has had severe anxiety and other serious mental health challenges, getting them to school every day has been a real challenge for this child and does affect attendance” – Parent
Figure 23: Likelihood of parents keeping their child out of school for ‘child having mental health challenges/anxiety’
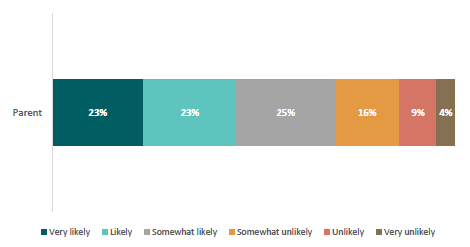
Figure twenty-three is a graph showing the likelihood of parents keeping their child out of school for ‘child having mental health challenges/anxiety’.
23% reported very likely.
23% reported likely.
25% reported somewhat likely.
16% reported somewhat unlikely.
9% reported unlikely.
4% reported very unlikely.
For some learners, mental health and anxiety are barriers to attendance
Some learners identified mental health and anxiety challenges as reasons for not attending.
“I’d say mental health and anxiety is a big reason some kids don’t enjoy school I know because it affected me” – Learners
“Mental health -struggling to function in day-to-day life” – Learner
About a quarter of the schools reported increases in mental health or school-work related anxiety as reasons for absence.
c) Bullying and other friend-related issues
Aotearoa New Zealand has high rates of bullying, which can be a barrier to going to school.
A third of parents keep their children home to avoid bullying
More than a third of parents (38 percent) are likely or very likely to not send their child to school if their child is being bullied. Four percent of parents kept their child home in the last term due to bullying.
Figure 24: Likelihood of parents keeping their child out of school for ‘child being bullied’
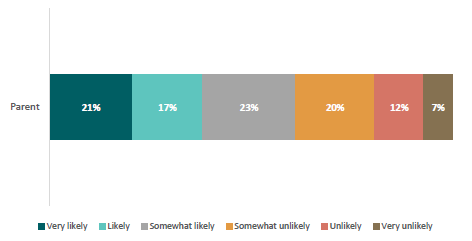
Figure twenty-four is a graph showing the likelihood of parents keeping their child out of school for ‘child being bullied’.
21% reported very likely.
17% reported likely.
23% reported somewhat likely.
20% reported somewhat unlikely.
12% reported unlikely.
7% reported very unlikely.
Parents in the focus groups identified bullying and social issues as reasons for not sending their children to school.
“Bullying, there have been a couple of kids physically attack and make racist remarks” - Parent
“When I feel school is unsafe for my child” – Parent
“Bullying, and my son struggles to fit in and there isn’t really a lot of help” – Parent
Bullying makes learners not want to go to school
Bullying and friends matters to learners. One in 10 learners (10 percent) indicated experiences of bullying made them want to miss school. Three percent of learners identified this as a reason for not going to school in the last two weeks.
Nearly one in six (15 percent) learners said not liking the people in their class made them want to miss school and 5 percent of learners said not wanting to be around their classmates was a reason they hadn’t attended in the last two weeks.
Learners in the focus groups identified bullying as something that gets in the way of attending school.
“Stuff at school, bullying, no friends, friend drama (choose not to go to an adult because you don’t want to be a snitch) – happens often; others get involved – ie siblings; social media pages being set up to target learners’’ – Learner
“Somebody teases you and bullies you every day’’ – Learner
Figure 25: Percentage of learners identifying social-related reasons for wanting to miss school
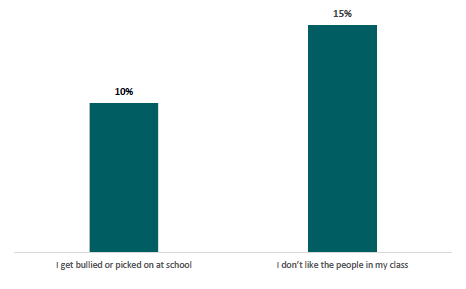
Figure twenty-five is a graph showing the percentage of learners identifying the following two social-related reasons for wanting to miss school.
10% reported ‘I get bullied or picked on at school.’
15% reported ‘I don’t like the people in my class.’
d) Certain school activities
Some school events or activities can lead to learners missing school
Nearly two in 10 parents (18 percent) are likely or very likely to not send their child to school if they are unable to participate in a planned school activity (for example, swimming sports). We heard that 2 percent of parents had kept their child home for this reason in the last term.
Figure 26: Likelihood of parents keeping their child out of school for ‘child not being able to participate in a school activity’
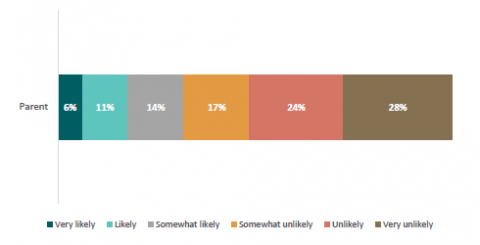
Figure twenty-six is a graph showing the likelihood of parents keeping their child out of school for ‘child not being able to participate in a school activity’.
6% reported very likely.
11% reported likely.
14% reported somewhat likely.
17% reported somewhat unlikely.
24% reported unlikely.
28% reported very unlikely.
We also heard in the focus groups with parents that certain school activities and events discouraged attendance.
“Sports day or swimming he is allowed to miss.” – Parent
“Not wanting to do something on that day. Son is shy, doesn’t like performing, when there are speeches, will do anything to stay home.” – Parents
“Sporting events- not wanting to participate. Swimming sports, cross country. It’s about peer influence- care too much about what others think and say” -Parent
A fifth of learners miss school to avoid certain activities
We found that 21 percent of learners wanted to miss school as they didn’t want to participate in certain school activities.
Figure 27: Percentage of learners identifying school activities as reasons for wanting to miss school
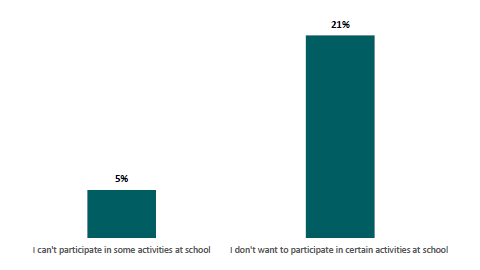
Figure twenty-seven is a graph showing the percentage of learners identifying school activities as reasons for wanting to miss school.
5% reported ‘I can’t participate in some activities at school.’
21% reported ‘I don’t want to participate in certain activities at school’.
Six percent of learners said wanting to avoid something at school had led to them missing school in the last two weeks.
Learners in the focus groups also identified avoiding certain events as a reason making them want to miss school. Learners talked about feeling self-conscious and afraid to do activities in front of peers and some disliked certain activities so much they would avoid school that day.
“Nervous on cross country days if you feel you are going to lose’’ – Learner
e) Lack of engagement with school
Parents do not always make learners go to school
We found that 7 percent of parents are likely or very likely to not send their child to school if their child did not want to go to school. Seven percent of parents also had not sent their child to school in the last term because their child had not wanted to go.
In the focus groups with parents we also heard that children not wanting to attend school was a reason for not sending their child to school.
“If child voices that she doesn’t want to go, we will listen” – Parent
Parents told us that being disengaged from school, not being interested in what is taught, and not having a positive relationship with teachers were reasons they felt their children were not keen to go to school.
“When the programme is boring” – Parent
“Teachers might not like them, don’t want to go to their class. If you enjoy the teacher and you’re learning from them, you’ll like to be there. If not you won’t want to be there.” – Parent
“Lack of recognition from teachers, de-motivated them from going the next day.” – Parent
Lack of engagement makes learners want to miss school
Schooling factors are a driver for some learners not wanting to attend school. We found:
- just under two in 10 learners (18 percent) not liking or being interested in what is taught at school
- just under two in 10 learners (17 percent) not liking at least one of their teachers
- just over one in 10 learners (13 percent) finding their schoolwork too hard
- just under one in 10 learners (7 percent) of learners finding their schoolwork too easy
- five percent of learners not seeing how school will help them in the future.
Figure 28: Percentage of learners identifying lack of engagement reasons for wanting to miss school
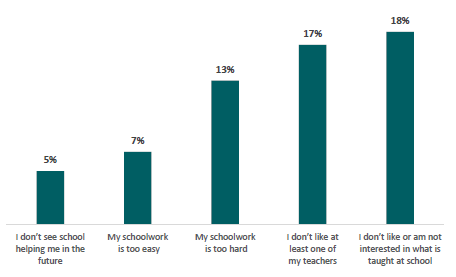
Figure twenty-eight is a graph showing the percentage of learners identifying lack of engagement as reasons for wanting to miss school. 5% reported ‘I don’t see school helping me in the future.’ 7% reported ‘my schoolwork is too easy.’ 13% reported ‘my schoolwork is too hard’. 17% reported ‘I don’t like at least one of my teachers.’ 18% reported ‘I don’t like or am not interested in what is taught at school.’
Almost two in 10 learners (19 percent) identified not feeling like going to school as a reason for not having gone in the last two weeks
Teaching and learning that was boring, unengaging, or repetitive was identified in the focus groups as reasons for not attending, which often stemmed from negative teacher relationships.
“Teachers; some don’t connect with learners; some seem like they hate kids; they target you; makes you ditch or want to ditch certain periods’’ -Learner
“Some classes are boring. Can’t sit next to friends. Just writing with pen and paper’’. – Learner
“Don’t like school. It is too repetitive across the years. You are learning the same thing year after year. Not learning new things.’’ – Learner
“The core subjects you have to do can put you off. If you don’t want to do anything like that in the future’’ – Learners
Schools reported learners are missing more parts of day, either by missing classes during the day or starting school late.
f) Lack of sleep
One in 10 parents keep their children home because they are tired
Just over one in 10 parents (12 percent) are likely or very likely to not send their child to school if their child was tired. We heard that 10 percent of parents did keep their child home for tiredness in the last term.
Figure 29: Likelihood of parents keeping their child out of school for ‘child being tired’
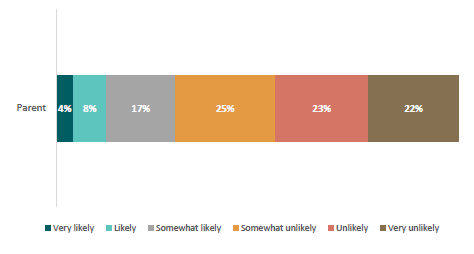
Figure twenty-nine is a graph showing the likelihood of parents keeping their child out of school for ‘child being tired’.
4% reported very likely.
8% reported likely.
17% reported somewhat likely.
25% reported somewhat unlikely.
23% reported unlikely.
22% reported very unlikely.
Tiredness was a common reason identified in the parent focus group for their child not attending.
“I gauge their energy, if they have had a long week of activities and look really tired, they need a break” – Parent
“15 year olds don’t work well in the morning, they are growing and they are tired. Why can’t we start school later?” – Parent
“Hard to get bed early so wakes up tired” – Parent
A third of learners found tiredness to be a barrier to attendance
A third of learners (35 percent) indicated that getting up in the morning when they had been up late made them want to miss school.
In the focus groups learners identified being tired as something that made them want to miss school.
“Being tired – sometimes we have lots of things after school’’ – Learner
“It’s hard to get up’’ – Learner
“Get home late from extra- curricular activities – too tired to go next day’’- Learner
Schools also identified tiredness as a something that discourages learners from attending.
“Parents more inclined to keep at home for tiredness” – Teacher/school leader
“Staying up so late on gaming or other things – so too tired” – Teacher/school leader
g) Transport
Transport challenges can be a barrier to going to school
Over one in 10 (10 percent) parents are likely or very likely to not send their child to school if transport was challenging and 5 percent of parents kept their child home due to transport issues in the last term.
Figure 30: Likelihood of parents keeping their child out of school for ‘transporting child to school being challenging’
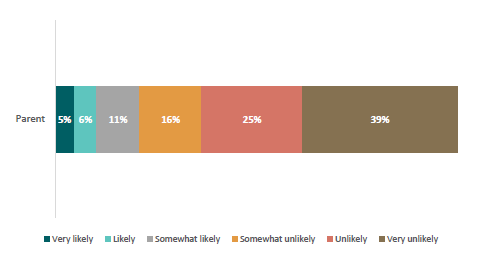
Figure thirty is a graph showing the likelihood of parents keeping their child out of school for ‘transporting child to school being challenging’.
5% reported very likely.
6% reported likely.
11% reported somewhat likely.
16% reported somewhat unlikely.
25% reported unlikely.
39% reported very unlikely.
Weather events and difficulty transporting children to school was identified by parents as challenges in the survey responses and in the parent focus groups.
“Unable to transport them to school due to lack of transport, too far to walk to bus, no vehicle, school 20 kms plus from home” – Parent
“Safety- if the weather is really bad, keep them home. Flood, trees coming down, feel better keeping them at home” – Parent
One in three schools also identified difficulties with transport as influencing attendance in their school community.
“Transport becoming an issue to get to school” – School leader
“Most kids travel by bus - if you miss the bus then that's it” – School leader
We found 6 percent of learners identified difficulties getting to and from school as a reason for wanting to miss school. Three percent of learners were unable to attend school due to transport difficulties in the last two weeks.
Learners in the learner focus groups also identified getting to school as a challenge that interfered with attendance.
“Sometimes there is only one bus – and if you miss it you are late or can’t come. Sometimes school doesn’t understand’’ – Learner
h) Hardship
Lack of equipment or money is a barrier for one in 10 parents
Just over one in 10 parents (13 percent) are likely or very likely to not send their child to school if they did not have the right equipment (for example, shoes, uniform, money for events).
Figure 31: Likelihood of parents keeping their child out of school for ‘child not having the right equipment to attend school’
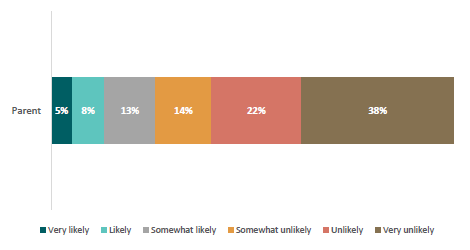
Figure thirty-one is a graph showing the likelihood of parents keeping their child out of school for ‘child not having the right equipment to attend school’.
5% reported very likely.
8% reported likely.
13% reported somewhat likely.
14% reported somewhat unlikely.
22% reported unlikely.
38% reported very unlikely.
Lack of resources was also identified in parents’ open-ended survey responses as a reason for absence in the last term.
“I feel ashamed to say that when I haven't had enough money for something to put into school lunches and when there have been school trips that I couldn't afford I haven't sent my son to school.” – Parent
Ten of the 40 schools we talked to identified material hardship (income, poverty, lack of food) as a factor influencing attendance in their school community.
“Poverty - price of petrol - instead of coming five days - they can only afford to come three” - School leader
Ten of the 40 schools we talked to identified housing (including emergency housing, housing development, and displacement through Covid-19) as a factor influencing attendance in their school community.
“We have a big housing development in our area - housing has been disrupted - some families have been moved out of homes while demolished and rebuilt - has impacted us as a school - housing in general - people moving slightly further away” – School leader
“We have had known cases of learners living in cars or living in the caravan park.” – School leaders
More than one in 10 learners do not have what they needed to go to school
More than one in 10 (13 percent) learners reported that they never, rarely, or only sometimes had everything they needed to go to school (for example, uniform, shoes, jacket, lunch).
Figure 32: Frequency of learners having everything they need to go to school
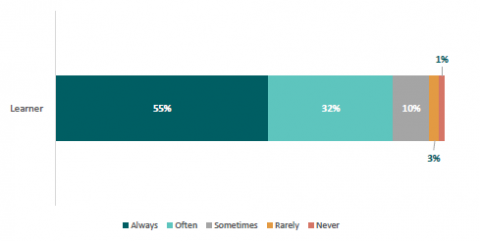
Figure thirty-two is a graph showing the frequency of learners having everything they need to go to school. 55% reported always.
32% reported often.
10% reported sometimes.
3% reported rarely.
1% reported never.
Learners identified hardship reasons for non-attendance.
“No petrol in car, no food” – Learner
“They don’t have clean uniforms or they find learning hard. Some are tired or hungry.” - Learner
Conclusion
Aotearoa New Zealand’s concerning levels of attendance reflect the value placed on attendance, prioritisation of other activities, and barriers to attendance.
The three things that are most commonly prioritised above school attendance are:
- family and special events
- holidays
- sporting and cultural events.
The three most common barriers are:
- physical health
- mental health
- bullying.
Families experiencing material hardship are likely to experience these barriers at higher rates and additional barriers including transport challenges and a lack of resources to support schooling (for example, equipment, uniforms, food etc).
The findings from the teacher and school interviews and focus groups are largely consistent with the parent and learner surveys and interviews.
Part 5: When and why are learners going to school?
Everyday most learners in Aotearoa New Zealand go to school. They are motivated by a range of reasons including expectations and opportunities to learn, socialise, and do interesting things. Understanding these reasons can help us improve attendance. This section sets out the reasons why learners go to school.
This section shares what parents and learners told us about what motivates them to attend school, or to send their children to school. These are:
- Important learning for the future
- Opportunities to socialise and learn social skills
- Opportunities to do fun and interesting things
- Expectations (law, societal, from schools and parents) to attend
1. Important learning for the future
Nearly all parents and half of learners see school as providing useful learning for the future
Parents in our surveys and focus groups identified learning, getting an education, and gaining important life skills and attitudes as key reasons for sending their children to school.
“Important for the kids to be there through the school years. If you don’t turn up then you don’t learn the things that you are supposed to’’ – Parent
“Schooling is vital. Especially for the education outcomes, and preparing them for a working life and getting them to be committed to be in one place and not necessarily having fun, and learning to work’’ – Parent
Figure 33: Extent to which parents think school helping their child to learn useful skills and knowledge is an important reason when sending their child to school
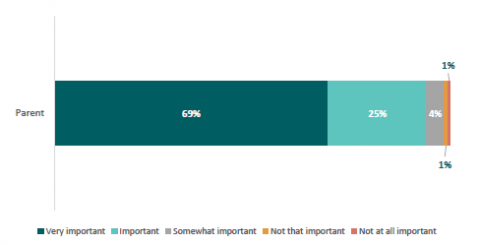
Figure thirty-three is a graph showing the extent to which parents think school helping their child to learn useful skills and knowledge is an important reason when sending their child to school.
69% reported very important.
25% reported important.
4% reported somewhat important.
1% reported not that important.
1% reported no at all important.
Just over half (54 percent) want to go to school as they see how school could help them in the future. In addition, nearly four in 10 (37 percent) learners said they liked and are interested in what is being taught.
Figure 34: Percentage of learners identifying important learning for the future as reasons for wanting to go to school
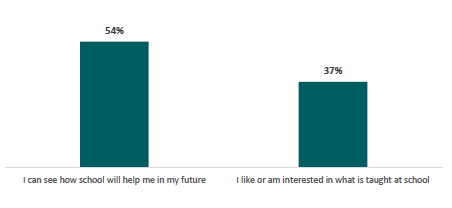
Figure thirty-four is a graph showing the percentage of learners identifying important learning for the future as reasons for wanting to go to school.
54% reported ‘I can see how school will help me in my future.’
37% reported ‘I like or am interested in what is taught at school.’
Learning important things and gaining life and future skills were two of the most common reasons given for going to school by learners in our focus groups. Fear of falling behind in learning was also a motivator for school attendance for some of these learners.
“Because the teachers might teach something important like spelling and if you need to do something formal in the future – you will need it. Or if you are buying something in a shop and someone was trying to cheat you – you would know’’ – Learner
“You can miss so much in a day. Hard to get myself back in the game.’’ – Learner
Schools also identified learners caring about their education and it being linked to their goals as motivators for attending.
2. Opportunities to socialise and learn social skills
Most parents and learners valued the social life of school
Going to school to socialise, build social skills, and make friends were key reasons for sending their children to school for parents in our surveys and focus groups. Parents in our focus groups understood that seeing and being with their friends was an important motivator for their children’s attendance at school, sometimes stronger than the learning.
“Socially if you aren’t there for certain school events, you aren’t part of community building. School offers community aspects which are important as well.’’ -Parent
“School is absolutely vital in terms of routine and social development – developing a peer group that they can relate to outside of their immediate family.’’ – Parent
Figure 35: Extent to which parents think school helping their child develop social skills is an important reason when sending their child to school
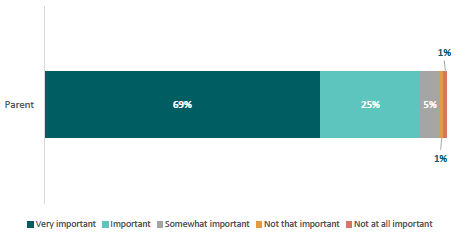
Figure thirty-five is a graph showing the extent to which parents think school helping their child develop social skills is an important reason when sending their child to school.
69% reported very important.
25% reported important.
5% reported somewhat important.
1% reported not that important.
1% reported no at all important.
For most learners (80 percent), seeing and spending time with their friends makes them want to go to school.
Socialising and learning social skills were key reasons for attending school identified by learners in the focus groups also.
“Mates give you motivation’’ – Learner
“Because you can’t google social skills’’ – Learner
Many parents and learners value school for the supportive environment it provides
Schools can be a safe and supportive place that makes learners want to attend.
One in two (50 percent) learners have an adult at school who really cares about them.
For one in five learners (19 percent), school being somewhere they feel safe (physically, socially, and emotionally) makes them want to attend.
Around four in 10 learners (41 percent) indicated liking at least one teacher made them want to go to school and just over one in 10 (12 percent) indicated talking to adults they trust also made them want to go to school.
For nearly one in seven (14 percent) learners, getting food at school is a reason that made them want to go to school.
Figure 36: Percentage of students identifying social reasons for wanting to go to school
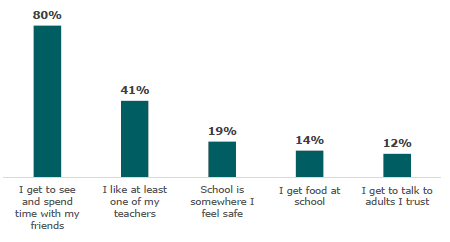
Figure thirty-six is a graph showing the percentage of learners identifying social reasons for wanting to go to school.
80% reported ‘I get to see and spend time with my friends.’
41% reported ‘I like at least one of my teachers.’
19% reported ‘school is somewhere I feel safe.’
14% reported ‘I get food at school.’
12% reported ‘I get to talk to adults I trust.’
Learners in the focus groups also identified positive social interactions with teachers as a key motivator for going to school.
“Having your fave subjects and seeing your fave teachers’’ – Learner
“People (teachers) who keep us motivated and have our backs’’ – Learner
“Teacher who understands’’ - Learner
Parents in our focus groups also identified that positive social interactions with teachers was a motivating factor for their children attending school.
“The social aspect encourages her to attend. Having engaging, respectful and knowledgeable teachers. The classes where the teachers show that – she is keen to go to.’’ – Parent
3. Opportunities to do fun and interesting things
Learners and parents value the opportunities school provides to do fun and interesting activities
Nearly eight in 10 parents (79 percent) think that school being fun for their child is an important or very important reason for sending their child to school.
Figure 37: Extent to which parents think school being fun for their child is an important reason when sending their child to school
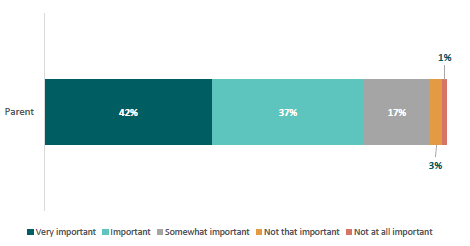
Figure thirty-seven is a graph showing the extent to which parents think school being fun for their child is an important reason when sending their child to school.
42% reported very important.
37% reported important.
17% reported somewhat important.
3% reported not that important.
1% reported no at all important.
In focus groups parents spoke about the importance of experiences such as school camps, trips, visiting performers and experts, sports, science fairs, technology programmes, kapa haka, and school productions. Parents saw these as opportunities to learn collaboratively, draw on learner strengths and interests, and to apply learning in settings beyond school. They also saw them as opportunities they could not easily replicate at home.
“Time on technology. Lunchtime sports. If there is something fun on – bake sales, school trips, dress-up days” – Parents
“A particular sporting activity, favourite class – ie art – those days he is motivated’’ – Parent
“Every day is a new day- they are learning new things – ie kapa haka. New activities. Things they don’t get a chance to do at home.’’ – Parent
Similarly, four in 10 learners (41 percent) want to go to school to do activities such as sports or clubs. More than one in five learners (22 percent) want to go to school as it is better than being at home.
Figure 38: Percentage of students identifying fun activities as reasons for wanting to go to school
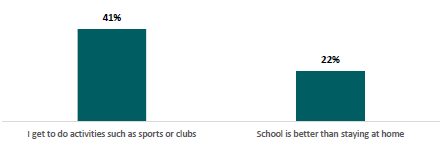
Figure thirty-eight is a graph showing the percentage of students identifying fun activities as reasons for wanting to go to school.
41% reported ‘I get to do activities such as sports or clubs.’
22% reported ‘school is better than staying at home.’
Doing fun and interesting things was the most common motivator for going to school identified by learners in focus groups. The opportunity to participate in co-curricular activities through school was also mentioned.
“Classes when you do things you enjoy – things that use your hands’’ – Learners
“If you go to school you can do after school activities – like sport. They send you home if you haven’t been at school’’ – Learners
“To do some activities at our school you have to have 85 percent attendance’’ – Learners
Schools also identified doing fun and interesting activities at school as a motivator for their learners coming to school.
4. Expectations to attend
Parents send their children to school because it is the law
For 58 percent of parents, the law requiring they send their children to school was an important or very important reason for them to send their child to school.
In addition, nearly half (48 percent) of parents send their children to school because they had other things they needed to do (such as work).
Figure 39: Extent to which parents think the law saying they have to send their child to school is an important reason when sending their child to school
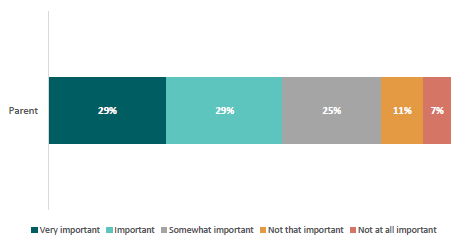
Figure thirty-nine is a graph showing the extent to which parents think the law saying they have to send their child to school is an important reason when sending their child to school.
29% reported very important.
29% reported important.
25% reported somewhat important.
11% reported not that important.
7% reported no at all important.
We also heard in the focus groups that needing to send their child to school was a reason for parents sending them.
“I work fulltime – so there is a domino effect of letting my team down if I have to be at home with my child’’ - parent
Schools also reported needing to go to work was a key motivation for parents sending their children to school.
Learners are also motivated by parents and school’s expectations
Most learners (90 percent) agreed their parents cared if they go to school. Sixty-six percent also agreed that their parents or whānau are proud when they go to school.
Those who agreed that
- their parents cared if they went to school
- their school cared if they went to school
- they had an adult at school who really cared about them
Are more likely to:
- think school is important,
- want to go to school more days a week
- feel like going to school always or often
- have missed fewer days in the previous week.
Figure 40: Extent to which learners agree or disagree with the statement ‘My parents/caregivers care if I go to school’
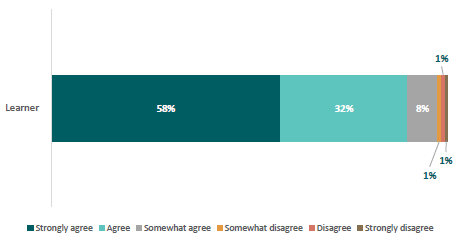
Figure forty is a graph showing the extent to which learners agree or disagree with the statement ‘My parents/caregivers care if I go to school’.
58% reported strongly agree.
32% reported agree.
8% reported somewhat agree.
1% reported somewhat disagree.
1% reported disagree.
1% reported strongly disagree.
Parents’ expectations were a motivation to attend school mentioned in every learner focus group.
“Parents make you or encourage you to go. They want you to do well.’’ – Learner
“Strict parents make you go’’ – Learner
School expectations also made a difference. Nearly three in four learners agree (74 percent) or strongly agree that their school cares if they went to school. One in four learners (25 percent) go to school to avoid getting into trouble for not attending.
Figure 41: Extent to which learners agree or disagree with the statement ‘My school cares if I go to school’

Figure forty-one is a graph showing the extent to which learners agree or disagree with the statement ‘My school cares if I go to school’.
38% reported strongly agree.
36% reported agree.
19% reported somewhat agree.
3% reported somewhat disagree.
2% reported disagree.
1% reported strongly disagree.
Conclusion
Both parents and learners are aware of, and influenced by, expectations for attendance. Parents are also highly motivated by their understanding that learning at school was important for their children’s future, and for their children to socialise and develop social skills.
Learners themselves are motivated by their parents’ expectations but are less likely than parents to see their school learning as relevant to their future. Learners are very motivated by getting to spend time with their friends and to have opportunities to do fun things at school. They are more likely to attend if they have good relationships with their teachers and are interested in the things they are learning.
Part 6: What drives attendance for Māori learners?
Attendance of Māori learners has declined at a faster rate than other learners although most Māori learners and their parents have positive attitudes to school and attendance. This chapter sets out the barriers Māori learners and their parents face, and what motivates Māori learners to attend.
Attendance of Māori learners
Māori learners’ regular attendance level in Term 2 2021 was 44 percent and has declined from 57 percent since 2015 as set out in the graph below.
Figure 42: Māori learners’ regular attendance level over time (2015-2021)
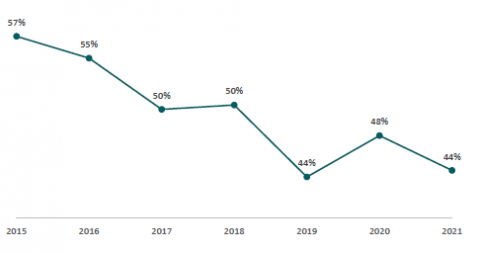
Figure forty-two is a graph showing Māori learners’ regular attendance rate over time from 2015 to 2021.
The rate continuously decreased from 57% in 2015 to 44% in 2019. It went up to 48% in 2020 and dropped to 44% in 2021.
This attendance level is lower and has declined faster than the overall learner population. This may reflect how education continues to underdeliver for Māori and the barriers they face to attendance. This section sets out the reasons why Māori learners miss school, their barriers to attendance, and their reasons for attending.
Reasons for missing school
This section looks at the following reasons for missing school:
- Not valuing school or regular attendance
- Prioritising other activities
- Experiencing barriers to attendance
1. Not valuing school or regular attendance
One in 10 Māori parents and one in four Māori learners do not see school as important
Eleven percent of Māori parents and 24 percent of Māori learners think school is either somewhat important, not that important, or not important at all. This is the same as the overall learner population.
Figure 43: Extent to which Māori learners and parents think school is important for their/ their child’s future
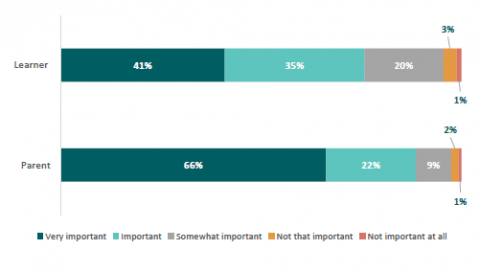
Figure forty-three is a graph showing the extent to which Māori learners and parents think school is important for their/ their child’s future.
In terms of learners,
41% reported very important.
35% reported important.
20% reported somewhat important.
3% reported not that important.
1% reported not important at all.
In terms of parents,
66% reported very important.
22% reported important.
9% reported somewhat important.
2% reported not that important.
1% reported not important at all.
One in 10 Māori parents and nearly a third of Māori learners do not see attending school every day as that important
Nine percent of Māori parents and 31 percent of Māori learners see attending school every day as either somewhat important, not that important, or not important at all. Again, this is the same as the overall learner population.
‘’It’s not important to come every day because a lot of the stuff we teach at school isn’t useful for real life- - ie getting a job.’’ - learner
Figure 44: Extent to which Māori learners and parents think going to school every day is important for them/ their child
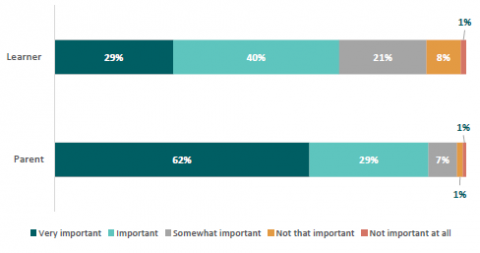
Figure forty-four is a graph showing the extent to which Māori learners and parents think going to school every day is important for them/ their child.
In terms of learners,
29% reported very important.
40% reported important.
21% reported somewhat important.
8% reported not that important.
1% reported not important at all.
In terms of parents,
62% reported very important.
29% reported important.
7% reported somewhat important.
1% reported not that important.
1% reported not important at all.
The majority of Māori parents do value attendance and school. They reported learning, socialising, and building habits and attitudes for the future as reasons why it was important.
“School is important. I grew up with a father who wouldn’t allow us to miss school, unless dying you still went because it was important. I’ve been the same with my children. If you aren’t there you miss things, if you get behind you feel whakamā, play catch up, end up with work to take home. Socially if you aren’t there for certain school events, you aren’t part of community building. School offers community aspect which is important as well. It all adds up if you are too loose.” - Parent
2) Prioritising other activities
Parents
Māori parents are most likely to keep their children home from school for whānau or cultural events, short whānau holidays, and sports events. Māori parents are more likely than non-Māori to see whānau or cultural events (81 percent to 63 percent), or having their child look after another whānau member (11 percent to 6 percent) as a reason to keep their child out of school.
Figure 45: Percentage of Māori parents who are likely or very likely to keep their child out of school for reasons associated with prioritising other activities
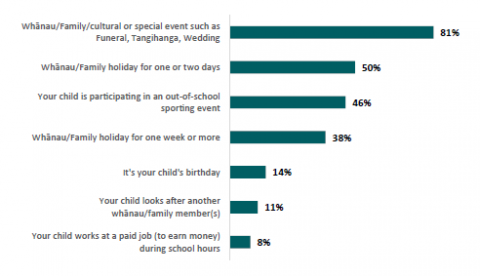
Figure forty-five is a graph showing the percentage of Māori parents who indicated they are likely or very likely to keep their child out of school for reasons associated with prioritising other activities.
81% reported ‘Whānau/family/cultural or special event such as funeral, tangihanga, wedding.’
50% reported ‘whānau/family holiday for one or two days.’
46% reported ‘your child is participating in an out of school sporting event.
38% reported ‘whānau/family holiday for one week or more.’
14% reported ‘It’s your child’s birthday.’
11% reported ‘your child looks after another whanau/family member(s).
8% reported ‘Your child works at a paid job (to earn money) during school hours.’
We found that Māori parents of learners in low decile schools are more likely to keep their child out of school for whānau, family or cultural events (84 percent) than Māori parents of learners in high decile schools (68 percent).
‘’We take time off for tangi. We live far away from some parts where family are. It can take 3-4 days to travel there. Would be the same for a wedding. Pre high school I was okay pulling them out to go to those. When they get to high school, they will get significantly behind, so it has to be a really good reason.’’ - parent
Learners
Māori learners also indicated the importance of whānau and community. Māori learners are more likely than non-Māori to prioritise whānau or cultural events (24 percent to 15 percent), or responsibilities looking after whānau members (13 percent to 6 percent) as reasons to miss school.
“A lot of tangihanga” - Learner
“having to go away to a different town for family stuff” - Learner
“sick family members takes its toll on hauora” - Learner
However, the same as other learners, Māori learners’ biggest reason to want to miss school is having more enjoyable things to do at home during the day.
Figure 46: Percentage of Māori learners who want to miss school for reasons associated with prioritising other activities
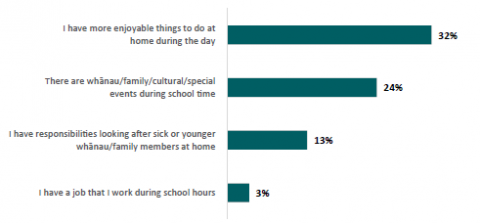
Figure forty-six is a graph showing the percentage of Māori learners who want to miss school for reasons associated with prioritising other activities.
32% reported ‘I have more enjoyable things to do at home during the day.’
24% reported ‘there are whanau or family or cultural or special events during school time.’
13% reported ‘I have responsibilities looking after sick or younger whānau or family members at home.’
3% reported ‘I have a job that I work during school hours.’
The reasons Māori learners were absent in the two weeks prior to the survey included whānau events (19 percent compared to 7 percent of non-Māori learners) and looking after a whānau member (12 percent compared to 5 percent of non-Māori learners).
Figure 47: Percentage of Māori learners who were absent in the last two weeks for reasons associated with prioritising other activities
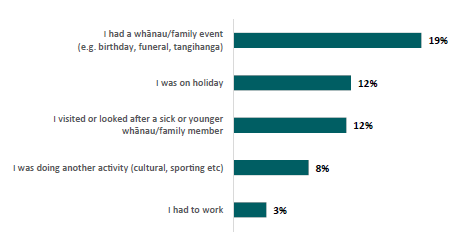
Figure forty-seven is a graph showing the percentage of Māori learners who were absent in the last two weeks for reasons associated with prioritising other activities.
19% were absent for ‘I have a whānau or family event, such as birthday, funeral, tangihanga).
12% were absent for ‘I was on holiday’.
12% were absent for ‘I visited or looked after a sick or younger whānau or family member.’
8% were absent for ‘I was doing another activity, such as cultural and sporting.’
3% were absent for ‘I had to work.’
3) Experiencing barriers to attendance
Parents
Like all parents, the most commonly identified barriers to attendance that Māori parents identified are illnesses and mental health challenges. Māori parents are more likely than other parents to keep their child home for a minor (74 percent compared to 64 percent) or chronic (70 percent compared to 61 percent) illness. Covid-19 may have had an impact on this. Intergenerational households mean Māori learners and Māori parents are more likely to keep children home to prevent the spread of illness.
“My daughter has respiratory issues. Before Covid I wasn’t too fussed about keeping kids home, but I have become more conscious. We don’t want to pass on cough to others. Don’t want to impact others by making them sick.” - Parent
Māori parents are also more likely to keep their child home for mental illness challenges (53 percent compared to 43 percent).
Bullying was identified by nearly half of Māori parents as a reason they would be likely or very likely to keep their child out of school. This is higher than non- Māori parents (49 percent of compared to 34 percent) and may reflect greater experiences of bullying.
“No friends there, school can be depressing, there’s racism. It’s not a great environment, school culture, a sense of inclusion is missing’’ - Parent
Their child being unable to participate in events is also more often identified by Māori parents as a barrier to attendance (24 percent compared to 16 percent).
The remaining reasons of not having the right equipment, their child being tired, transport being challenging, and their child not wanting to go showed very little differences between Māori and non-Māori parents.
Figure 48: Percentage of Māori parents who are likely or very likely to keep their child out of school for the reasons associated with barriers to attendance
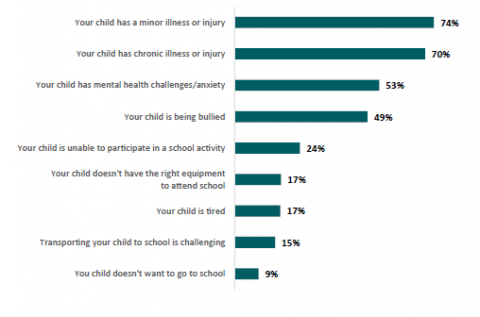
Figure forty-eight is a graph showing the percentage of Māori parents who indicated they are likely or very likely to keep their child out of school for the reasons associated with barriers to attendance.
74% reported for ‘your child has a minor illness or injury.’
70% reported for ‘your child has chronic illness or injury.’
53% reported for ‘your child has mental health challenges or anxiety.
49% reported for ‘your child is being bullied.’
24% reported for ‘your child is unable to participate in a school activity.’
17% reported for ‘your child doesn’t have the right equipment to attend school.’
17% reported for ‘your child is tired.’
15% reported for ‘transporting your child to school is challenging.’
9% reported for ‘your child doesn’t want to go to school.’
Learners
For Māori learners not wanting to get up early in the morning, not wanting to participate in certain activities at school, and not liking or being interested in what is taught at school are the most common reasons making them want to miss school. The barriers to attendance identified by Māori learners are very similar to the barriers to attendance identified by non-Māori learners.
Figure 49: Percentage of Māori learners who want to miss school for reasons associated with barriers to attendance
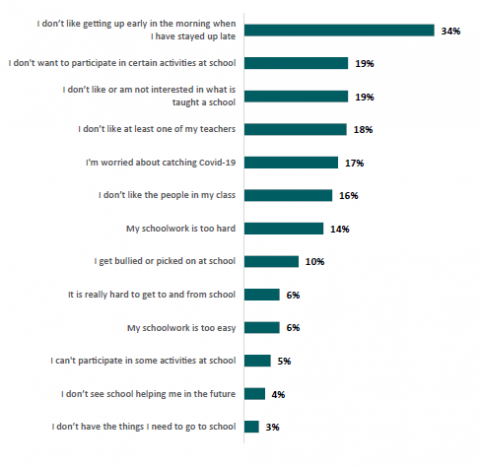
Figure forty-nine is a graph showing the percentage of Māori learners who want to miss school for reasons associated with barriers to attendance.
34% reported for ‘I don’t like getting up early in the morning when I have stayed up late.’
19% reported for ‘I don’t want to participate in certain activities at school.’
19% reported for ‘I don’t like or am not interested in what is taught at school.’
18% reported for ‘I don’t like at least one of my teachers.’
17% reported for ‘I am worried about catching Covid-19.’
16% reported for ‘I don’t like the people in my class.’
14% reported for ‘my schoolwork is too hard’.
10% reported for ‘I get bullied or picked on at school.’
6% reported for ‘it is really hard to get to and from school.’
6% reported for ‘my schoolwork is too easy.’
5% reported for ‘I can’t participate in some activities at school.’
4% reported for ‘I don’t see school helping me in the future.’
3% reported for ‘I don’t have the things I need to go to school.’
For Māori learners who hadn’t attended school in the last two weeks there was a similar pattern. Sickness was the most commonly identified reason for missing school, followed by learners not feeling like going (for example, being too tired). Wanting to avoid something at school and isolating from Covid-19 are the next most common reasons.
Figure 50: Percentage of Māori learners who were absent in the last two weeks for reasons associated with barriers to attendance
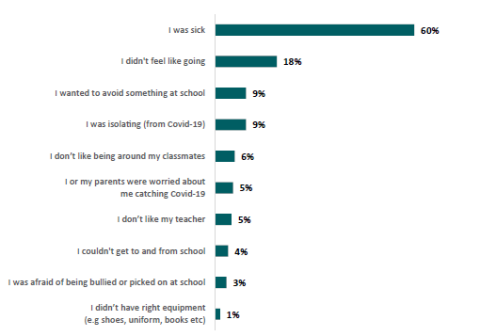
Figure fifty is a graph showing the percentage of Māori learners who were absent in the last two weeks for reasons associated with barriers to attendance.
60% were absent for ‘I was sick.’
18% were absent for ‘I didn’t feel like going.’
9% were absent for ‘I wanted to avoid something at school.’
9% were absent for ‘I was isolating from Covid-19.’
6% were absent for ‘I don’t like being around my classmates.’
5% were absent for ‘I or my parents were worried about me catching Covid-19.’
5% were absent for ‘I don’t like my teacher.’
4% were absent for ‘I couldn’t get to and from school.’
3% were absent for ‘I was afraid of being bullied or picked on at school.’
1% were absent for ‘I didn’t have right equipment, for example, shoes, uniform and books.’
One difference was how often Māori learners have everything they need to go to school. Two out of 10 (20 percent) Māori learners never, rarely, or only sometimes had everything they needed to go to school (for example, uniform, shoes, jacket, lunch). This was more often than for non-Māori learners (11 percent) and may reflect the higher levels of material hardship Māori face.
Reasons for attending
Most Māori learners got to school. While there are barriers that discourage Māori learners from attending school and their parents from sending them to school, there are also many reasons that motivate Māori learners to go to school and their parents to send them.
Parents
Their child learning social skills is the most common motivator for parents sending their children to school. This is closely followed by their child learning useful skills, and school being fun for their child.
Māori parents are less motivated by legal requirements (52 percent compared to 60 percent) or school being a place for their child while they do other things, for example, work (42 percent compared to 51 percent).
Figure 51: Percentage of Māori parents who feel the following reasons are important or very important when sending their child to school
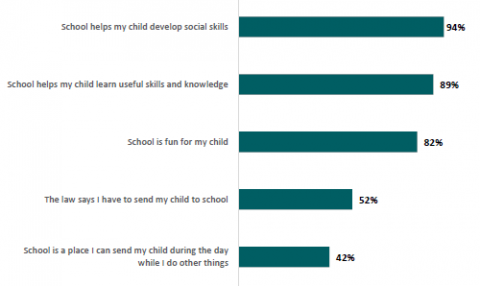
Figure fifty-one is a graph showing the percentage of Māori parents who feel the following reasons are important or very important when sending their child to school.
94% reported ‘school helps my child develop social skills’ is important or very important.
89% reported ‘school helps my child learn useful skills or knowledge’ is important or very important.
82% reported ‘school is fun for my child’ is important or very important.
52% reported ‘the law says I have to send my child to school.’ Is important or very important.
42% reported ‘school is a place I can send my child during the day while I do other things.’ Is important or very important.
Learners
The top three reasons Māori learners want to attend school are:
- getting to see and spend time with their friends (80 percent)
- getting to do activities such as sports or clubs (48 percent)
- seeing how school would help them in the future (45 percent).
Māori learners are less likely than other learners to be motivated to attend by liking or being interested in what is taught (30 percent compared to 38 percent) or by seeing how school would help them in the future (45 percent compared to 56 percent). This suggests that what they learn and how it is being taught is less engaging for Māori learners.
Māori learners are also more likely than other learners to be motivated to attend by getting to do activities such as sports or clubs (48 percent compared to 39 percent) and getting food at school (22 percent compared to 12 percent).
“my friends, more social interaction with my peeps.’’ - Learner
“activities (sport and cultural) at school, you have to have 85 percent attendance to participate.’’ - Learner
Figure 52: Percentage of Māori learners who want to attend school for each of the following reasons
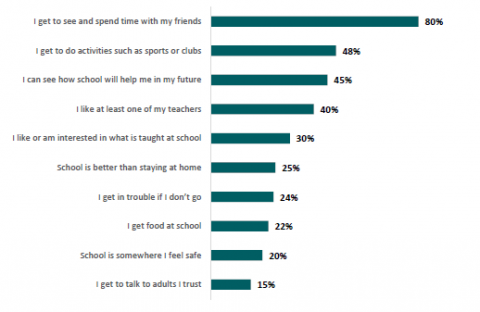
Figure fifty-two is a graph showing the percentage of Māori learners who want to attend school for each of the following reasons.
80% reported they want to attend school for ‘I get to see and spend time with my friends.’
48% reported they want to attend school for ‘I get to do activities such as sports or clubs.’
45% reported they want to attend school for ‘I can see how school will help me in my future.’
40% reported they want to attend school for ‘I like at least one of my teachers.’
30% reported they want to attend school for ‘I like or am interested in what is taught at school.’
25% reported they want to attend school for ‘school is better than staying at home.’
24% reported they want to attend school for ‘I get in trouble if I don’t go.’
22% reported they want to attend school for ‘I get food at school.’
20% reported they want to attend school for ‘school is somewhere I feel safe.’
15% reported they want to attend school for ‘I get to talk to adults I trust.’
For a high proportion of Māori learners there are clear expectations that they to go to school:
- Eighty-nine percent of Māori learners agreed or strongly agreed their parents care if they go to school
- Sixty-nine percent of Māori learners feel their family/whānau are proud when they go to school
- Seventy-six percent of Māori learners feel their school cared if they went to school
- Fifty-four percent of Māori learners feel they had an adult who really cares about them
These were all similar proportions as for non-Māori learners.
Conclusion
Māori learners’ attendance has fallen faster than other groups but most Māori parents and learners value school and attendance. Māori learners face additional barriers to attendance. For Māori parents, bullying and not being able to participate in school activities are barriers to their children’s attendance. Māori learners are less motivated to attend as school is less interesting or less relevant to them. Māori parents and learners place greater priority on whānau and community commitments than other learners.
Part 7: What drives attendance for Pacific learners?
Pacific attendance rates are lower and declining faster than other learners but most Pacific learners and their parents have positive attitudes to school and attendance.
This chapter sets out the value that Pacific learners and their parents place on attendance, the barriers they face and what motivates Pacific learners to attend.
Attendance levels
Pacific learners’ regular attendance level in Term 2 2021 was 45 percent and has declined from 61 percent since 2015 as set out in the graph below.
Figure 53: Pacific learners’ regular attendance level over time (2015-2021)
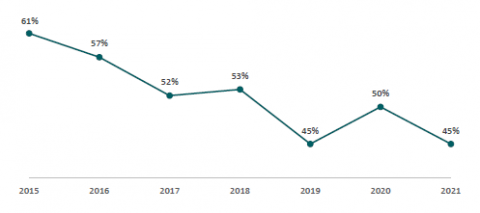
Figure fifty-three is a graph showing the Pacific learners’ regular attendance rate over time from 2015 to 2021.
The rate dropped from 61% in 2015 to 57% in 2016. It further decreased to 52% in 2017. It slightly went up to 53% in 2018 before dropping to 45% in 2019. After a small increase to 50% in 2020, it decreased again to 45% in 2021.
The attendance level for Pacific learners is lower and has declined faster than the overall learner population. This could reflect how the education system has consistently underdelivered for Pacific and the barriers they face to attendance. This chapter sets out the reasons why Pacific learners miss school, the barriers they face to attendance, and the reasons motivating them to attend.
Reasons for missing school
This section looks at the follow reasons for missing school:
- Not valuing school or regular attendance
- Prioritising other activities
- Experiencing barriers to attendance
1. Not valuing school or regular attendance
One in 10 Pacific parents and one in five Pacific learners find school not that important
Eight percent of Pacific parents and 19 percent of Pacific learners find school somewhat important, not that important, or not important at all for their future. This was the same for the overall parent and learner populations.
Figure 54: Extent to which Pacific learners and parents think school is important for their/ their child’s future
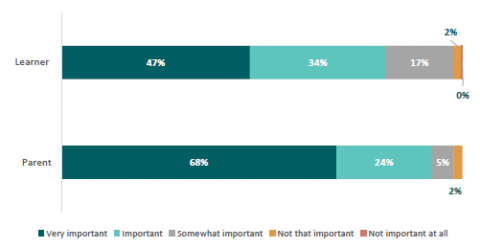
Figure fifty-four is a graph showing the extent to which Pacific learners and parents think school is important for their/ their child’s future.
In terms of learners,
47% reported very important.
34% reported important.
17% reported somewhat important.
2% reported not that important.
0% reported not important at all.
In terms of parents,
68% reported very important.
24% reported important.
5% reported somewhat important.
2% reported not that important.
Three in 10 Pacific learners and one in 10 Pacific parents think going to school every day is not that important
Twenty-nine percent of Pacific learners and 8 percent of Pacific parents find going to school every day either somewhat important, not that important, or not important at all. Again, this was the same for the overall population.
Figure 55: Extent to which Pacific learners and parents think going to school every day is important for them/ their child
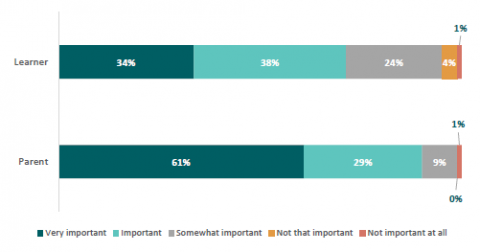
Figure fifty-five is a graph showing the extent to which Pacific learners and parents think going to school every day is important for them/ their child.
In terms of learners,
34% reported very important.
38% reported important.
24% reported somewhat important.
4% reported not that important.
1% reported not important at all.
In terms of parents,
61% reported very important.
29% reported important.
9% reported somewhat important.
1% reported not that important.
0% reported not important at all.
The vast majority of Pacific families do value school and attendance, mentioning learning, socialising, and developing life skills as reasons why it is important.
“School attendance is pretty important – so that they don’t miss out on learning. It sets them up for routine as they grow into adults. It’s important that they get that they have to get up and go – they can’t pick and choose.” - Parent
“When my child was younger – we took her to Tonga – she hardly went to school. Now I realise the importance of routine, and consistency – she came back and didn’t have friends. In hindsight she realizes that she wishes she had stayed in one place and made friends. Even before we went back to Tonga – someone said to me – you are moving around too much it will affect your children. It’s not until later that you realise.” - Parent
2. Prioritising other activities
Parents
Pacific parents are most likely to keep their child out of school for family and cultural events, holidays, and out of school sporting events. Pacific parents are also more likely to keep their child out of school than non-Pacific parents to look after a sick or younger family member (13 percent compared to 7 percent).
Pacific parents are less likely than non-Pacific parents to keep their child out of school for a holiday of one to two days (38 percent compared to 47 percent) or for an out of school sports event (33 percent compared to 41 percent).
“I would keep my children out of school to spend time with grandparents – if they are up we prioritise that time. Funerals and holidays – they are expensive – so we go out of school holidays I’m strict on everything else.” - Parents
“Definitely funerals – and with our funerals they can sometimes be two weeks long – it is important that they are learning about culture, cultural practices and family duties. I make sure they get involved in that.” - Parents
Figure 56: Percentage of Pacific parents who are likely or very likely to keep their child out of school for reasons associated with prioritising other activities
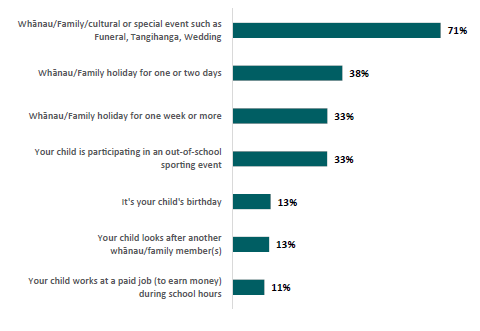
Figure fifty-six is a graph showing the percentage of Māori parents who are likely or very likely to keep their child out of school for reasons associated with prioritising other activities.
71% reported ‘Whānau/family/cultural or special event such as funeral, tangihanga, wedding.’
38% reported ‘whānau/family holiday for one or two days.’
33% reported ‘whānau/family holiday for one week or more.’
33% reported ‘your child is participating in an out of school sporting event.
13% reported ‘It’s your child’s birthday.’
13% reported ‘your child looks after another whanau/family member(s).
11% reported ‘Your child works at a paid job (to earn money) during school hours.’
Learners
Pacific learners are more likely than non-Pacific learners to say that the following things made them want to miss school:
- family and cultural events during school time (27 percent compared to 15 percent)
- having responsibilities looking after sick or younger family members (12 percent compared to 7 percent).
Pacific learners are less likely than non-Pacific learners to want to miss school for doing more enjoyable things at home (21 percent compared to 35 percent).
There are no differences between Pacific and non-Pacific learners missing school due to having a job to work during school hours.
“Some learners miss school because they’re sick, looking after people or at a funeral.” - Learner
Figure 57: Percentage of Pacific learners who want to miss school for reasons associated with prioritising other activities
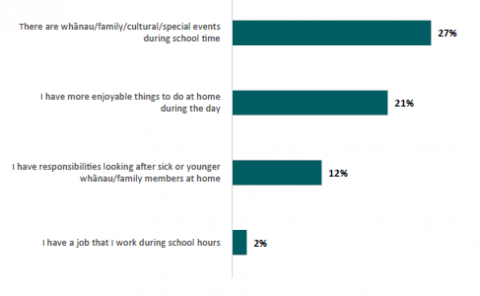
Figure fifty-seven is a graph showing the percentage of Pacific learners who want to miss school for reasons associated with prioritising other activities.
27% reported ‘there are whanau or family or cultural or special events during school time.’
21% reported ‘I have more enjoyable things to do at home during the day.’
12% reported ‘I have responsibilities looking after sick or younger whānau or family members at home.’
2% reported ‘I have a job that I work during school hours.’
Pacific learners’ reasons for actually missing school in the last two weeks closely reflect the priorities identified by them and Pacific parents. A higher proportion of Pacific learners than non-Pacific learners missed school in the last two weeks because they were:
- attending a family event (17 percent compared to 9 percent)
- looking after family members (14 percent compared to 5 percent).
Fewer Pacific learners reported being on holiday as a reason for missing school in the last two weeks (6 percent compared to 10 percent of non-Pacific learners). There were no differences between Pacific and non-Pacific students in terms of actual absences for working or doing another activity (for example, sport or cultural).
Figure 58: Percentage of Pacific learners who were absent in the last two weeks for reasons associated with prioritising other activities
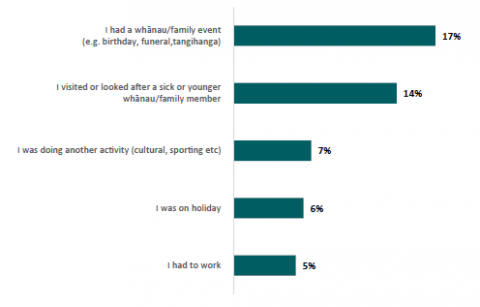
Figure fifty-eight is a graph showing the percentage of Pacific learners who were absent in the last two weeks for reasons associated with prioritising other activities.
17% were absent for ‘I have a whānau or family event, such as birthday, funeral, tangihanga).
14% were absent for ‘I visited or looked after a sick or younger whānau or family member.’
7% were absent for ‘I was doing another activity, such as cultural and sporting.’
6% were absent for ‘I was on holiday’.
5% were absent for ‘I had to work.’
3. Experiencing barriers to attending
Parents
Like all parents, the most common barriers to attendance reported by Pacific parents is minor and chronic illness and mental health challenges. Pacific parents are more likely to keep their child home due to a chronic illness (73 percent compared to 62 percent of non-Pacific parents). Covid-19 could have had an impact on this. With larger, intergenerational households it is possible that Pacific parents and learners are more inclined to miss school to prevent spread of illnesses.
Pacific parents are also more likely to keep their child home due to mental health challenges or anxiety (60 percent compared to 44 percent of non-Pacific parents).
“Maybe a sports day- neither child enjoys them. Certain teachers they don’t like, don’t feel they are supportive or they are grumpy. Racial bullying- do you contact the school? Might give them a mental health day at home.” - Parent
Pacific parents are more likely to keep children home from school due to tiredness (21 percent compared to 12 percent of non-Pacific parents), bullying (53 percent compared to 37 percent of non-Pacific parents), and not having the right equipment (23 percent compared to 12 percent for non-Pacific parents).
“Negative peer relationships can be challenging, lack of connection is a downward spiral. Not being connected to teaching staff – when there is a lack of expectations. They don’t notice or don’t mind if she is not there, turns into an ‘okay’ situation. Easy to find reasons not to engage when they are already disengaged.” - Parent
The remaining barriers of being unable to participate in certain activities, transporting their child being challenging, and their child not wanting to go to school are similar for Pacific and non-Pacific parents.
Figure 59: Percentage of Pacific parents who are likely or very likely to keep their child out of school for reasons associated with barriers to attendance
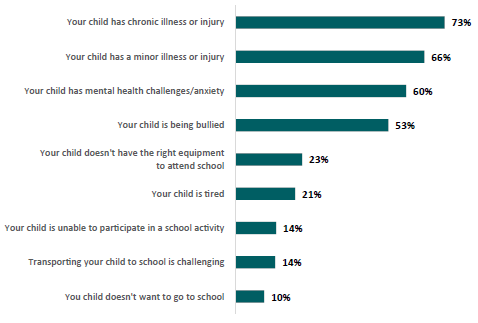
Figure fifty-nine is a graph showing the percentage of Pacific parents who are likely or very likely to keep their child out of school for the reasons associated with barriers to attendance.
73% reported ‘your child has chronic illness or injury.’
66% reported ‘your child has a minor illness or injury.’
60% reported ‘your child has mental health challenges or anxiety.
53% reported ‘your child is being bullied.’
23% reported ‘your child doesn’t have the right equipment to attend school.’
21% reported ‘your child is tired.’
14% reported ‘your child is unable to participate in a school activity.’
14% reported ‘transporting your child to school is challenging.’
10% reported ‘your child doesn’t want to go to school.’
Learners
For Pacific learners, not wanting to get up early in the morning, being worried about catching Covid-19, and schoolwork being too hard are the most common barriers making them want to miss school. Pacific learners and non-Pacific learners have similar experience of these barriers.
“Trouble with transport to school, don't find school useful or rewarding, or can't engage with certain teachers' learning methods.” - Learner
“Some people could feel unsafe at school because others bully them. Some people in my class also skip school because they go to sleep late and wake up late as well.” - Learner
Pacific learners are less likely to identify not wanting to participate in certain school activities as a reason to miss school (12 percent compared to 23 percent of non-Pacific learners).
Figure 60: Percentage of Pacific learners who want to miss school for the reasons associated with barriers to attendance
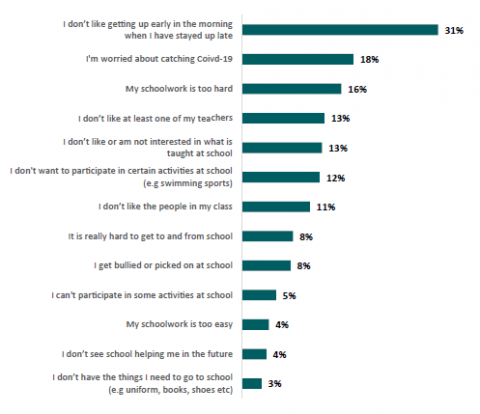
Figure sixty is a graph showing the percentage of Pacific learners who want to miss school for reasons associated with barriers to attendance.
31% reported ‘I don’t like getting up early in the morning when I have stayed up late.’
18% reported ‘I am worried about catching Covid-19.’
16% reported ‘my schoolwork is too hard’.
13% reported ‘I don’t like at least one of my teachers.’
13% reported ‘I don’t like or am not interested in what is taught at school.’
12% reported ‘I don’t want to participate in certain activities at school, for example swimming sports.’
11% reported ‘I don’t like the people in my class.’
8% reported ‘it is really hard to get to and from school.’
8% reported ‘I get bullied or picked on at school.’
5% reported ‘I can’t participate in some activities at school.’
4% reported ‘my schoolwork is too easy.’
4% reported ‘I don’t see school helping me in the future.’
3% reported ‘I don’t have the things I need to go to school, for example uniform, books, shoes etc.’
Looking at the previous two weeks for Pacific learners, the top barrier to attendance was sickness, followed by isolating from Covid-19, then not feeling like going.
Figure 61: Percentage of Pacific learners who were absent in the last two weeks for reasons associated with barriers to attendance
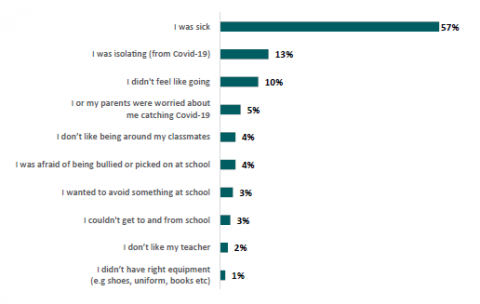
Figure sixty-one is a graph showing the percentage of Pacific learners who were absent in the last two weeks for reasons associated with barriers to attendance.
57% were absent for ‘I was sick.’
13% were absent for ‘I was isolating from Covid-19.’
10% were absent for ‘I didn’t feel like going.’
5% were absent for ‘I or my parents were worried about me catching Covid-19.’
4% were absent for ‘I don’t like being around my classmates.’
4% were absent for ‘I was afraid of being bullied or picked on at school.’
3% were absent for ‘I wanted to avoid something at school.’
3% were absent for ‘I couldn’t get to and from school.’
2% were absent for ‘I don’t like my teacher.’
1% were absent for ‘I didn’t have right equipment, for example, shoes, uniform and books.’
Reasons for attending
Everyday most Pacific learners are in school. While there are reasons that discourage Pacific learners from attending school, there are also motivating factors.
Parents
Similar to the findings for all parents, the most common motivating factors for Pacific parents to send their children to school are for their children to learn useful skills for the future and develop social skills.
“I think attendance and learning is really important. There is so much going on at school and things for them to learn and the activities going on.” - Parent
Figure 62: Percentage of Pacific parents who feel the following reasons are important or very important when sending their child to school
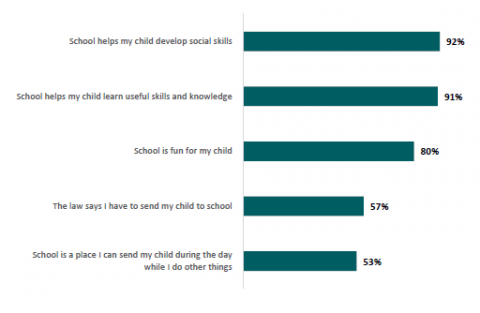
Figure sixty-two is a graph showing the percentage of Pacific parents who feel the following reasons are important or very important when sending their child to school.
92% reported ‘school helps my child develop social skills’
91% reported ‘school helps my child learn useful skills or knowledge’
80% reported ‘school is fun for my child’
57% reported ‘the law says I have to send my child to school.’
53% reported ‘school is a place I can send my child during the day while I do other things.’
Learners
Pacific learners are motivated to go to school by many things. The most common motivations are:
- getting to see and spend time with their friends (74 percent)
- seeing how school can help in their future (56 percent)
- getting to do activities such as sports or clubs (50 percent).
“Because we want to be smart and learn more and we can get a good job” - Learner
Compared to non-Pacific learners, Pacific learners are more likely to be motivated to attend school by:
- getting to do activities such as sports or clubs (50 percent compared to 40 percent)
- school being better than staying at home (33 percent compared to 21 percent)
- getting food at school (22 percent compared to 13 percent).
Fewer Pacific learners than non-Pacific learners are motivated to attend school because of getting to see and spend time with their friends (74 percent compared to 82 percent).
“We all play sports together at morning tea and lunch as a way of us catching up with each other” – Learner
Pacific learners are more likely to agree or strongly agree that:
- their whānau are proud of them when they go to school (74 percent compared to 65 percent)
- they have an adult at school who really cares about them (57 percent compared to 49 percent).
“I go to school to honour my grandparents’ sacrifices” - Learner
“Some of the teachers actually understand more than just teaching” - Learner
Figure 63: Percentage of Pacific learners who want to attend school for each of the following reasons
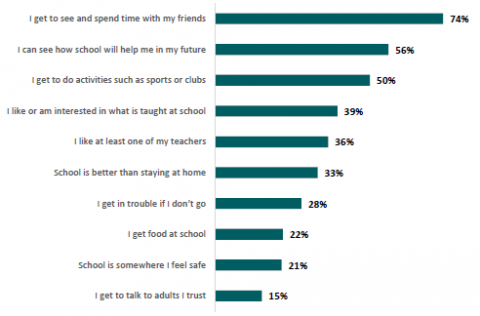
Figure sixty-three is a graph showing the percentage of Pacific learners who want to attend school for each of the following reasons.
74% reported they want to attend school for ‘I get to see and spend time with my friends.’
56% reported they want to attend school for ‘I can see how school will help me in my future.’
50% reported they want to attend school for ‘I get to do activities such as sports or clubs.’
39% reported they want to attend school for ‘I like or am interested in what is taught at school.’
36% reported they want to attend school for ‘I like at least one of my teachers.’
33% reported they want to attend school for ‘school is better than staying at home.’
28% reported they want to attend school for ‘I get in trouble if I don’t go.’
22% reported they want to attend school for ‘I get food at school.’
21% reported they want to attend school for ‘school is somewhere I feel safe.’
15% reported they want to attend school for ‘I get to talk to adults I trust.’
Conclusion
Pacific learners’ attendance is lower and has fallen at a faster rate than other groups. This is despite a high proportion of Pacific parents and learners valuing school and school attendance. Pacific parents and learners are more likely to prioritise family activities such as family and cultural events and looking after family members over school. Pacific parents are less likely to keep their kids out of school for things like sports or holidays. Pacific parents and learners experience sickness, bullying, and tiredness as greater barriers to attendance than other groups.
Part 8: Other differences across schools and learners
This section highlights how drivers of attendance are different for different learners and different school contexts. We found different drivers of attendance across different learner ages, school decile, rurality, and whether the learner has a disability. We also found different drivers of attendance for those who regularly attend school, and those that do not.
In the last two sections we looked at the different drivers of attendance for Māori and Pacific learners. This section describes the different drivers of attendance by:
- Learner age
- Decile
- Disability
- Rurality
- Whether the learner is a regular attender, or not
1. Learner age
Parents of younger learners (Years 4 to 6)
Parents of younger learners take holidays during term time more often than parents of older learners
Parents of younger learners are more likely to take their children out of school for both short (54 percent Year 4 to 6, 35 percent Year 11 to 13) and long holidays (37 percent Year 4 to 6, 26 percent Year 11 to 13).
In 2022, more parents of younger learners had taken their child out of school in the last term to go on a whānau/family holiday for one or two days (12 percent Year 4 to 6, 5 percent Year 11 to 13).
Parents in the focus groups said that attendance at school for younger age groups is less important than the learning experiences gained on holidays.
“At primary school, I would take children out of school for life experiences” – Parent
“When my son was younger I did some holidays, as he has gotten older it is more important he doesn’t miss school” – Parent
Figure 64: Percentage of parents of learners across different years who are likely or very likely to keep their child out of school for whānau/family holiday of different lengths
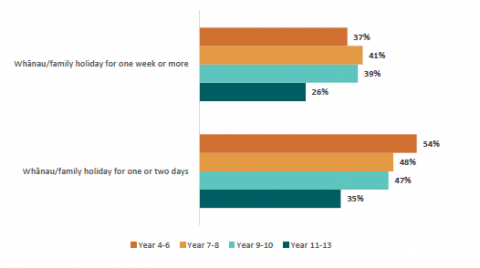
Figure sixty-four is a graph showing the percentage of parents of learners across different years who are likely or very likely to keep their child out of school for whānau/family holiday of different lengths.
37% parents of Year 4 to 6 students are likely or very likely to keep their child out of school for whānau/family holiday for one week or more.
41% parents of Year 7 to 8 students are likely or very likely to keep their child out of school for whānau/family holiday for one week or more.
39% parents of Year 9 to 10 are likely or very likely to keep their child out of school for whānau/family holiday for one week or more.
26% parents of Year 11 to 13 are likely or very likely to keep their child out of school for whānau/family holiday for one week or more.
54% parents of Year 4 to 6 are likely or very likely to keep their child out of school for whānau/family holiday for one or two days.
48% parents of Year 7 to 8 are likely or very likely to keep their child out of school for whānau/family holiday for one or two days.
47% parents of Year 9 to 10 are likely or very likely to keep their child out of school for whānau/family holiday for one or two days.
35% parents of Year 11 to 13 are likely or very likely to keep their child out of school for whānau/family holiday for one or two days.
Parents of younger learners are motivated to send their child to school by their child having fun at school…
Parents of younger learners are more likely than those of older learners to be motivated to send their child to school because school was a fun place to be (88 percent Year 4 to 6, 68 percent Year 11 to 13).
.. and as a place they could send their child while they did other things
As younger children cannot be left at home alone, parents of younger children are more motivated than parents of older learners to send their child to school so they could do other things, including going to work (58 percent Year 4 to 6, 38 percent Year 11 to 13).
Younger Learners
Younger learners are more positive about school
Younger learners are more positive about school and attending school. Younger learners are more likely than older learners (Year 11 to 13) to think:
- school is important or very important for their future (84 percent Year 4 to 6, 74 percent of Year 11 to 13)
- going to school every day is important or very important (79 percent Year 4 to 6, 52 percent of Year 11 to 13).
Younger learners are over twice as likely to want to go to school five days a week compared to older learners (59 percent Year 4 to 6, 25 percent Year 11 to 13).
Figure 65: Percentage of learners across different years who indicated going to school every day is important or very important
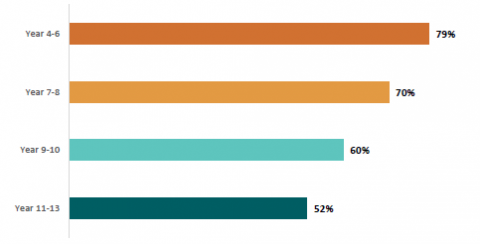
Figure sixty-five is a graph showing the percentage of learners across different years who indicated going to school every day is important or very important.
The percentage for Year 4 to 6 learners were 79%.
The percentage for year 7 to 8 learners were 70%.
The percentage for year 9 to 10 learners were 60%.
The percentage for year 11 to 13 learners were 52%.
Younger learners have stronger relationships at school
Younger learners feel more connected to their school. Younger learners are more likely than older learners to identify wanting to go to school because:
- they get to talk to an adult they trusted (18 percent Year 4 to 6, 6 percent Year 11 to 13)
- school was somewhere they felt safe (31 percent Year 4 to 6, 7 percent of Year 11 to 13).
They are also more likely than older learners to agree or strongly agree that:
- they had an adult at school that really cared about them (61 percent of Year 4 to 6, 37 percent of Year 11 to 13)
- their school cared if they went to school (79 percent Year 4 to 6, 62 percent Year 11 to 13 learners).
Other differences in the motivators for younger learners to attend school compared to older learners include:
- being more likely than older learners to feel their whānau are proud of them when they go to school (72 percent Year 4 to 6, 62 percent Year 11 to 13)
- being more likely than older learners to want to go to school to do activities such as sports or clubs (46 percent Year 4 to 6, 27 percent Year 11 to 13).
Younger learners are more likely to miss school because of family commitments…
Younger learners are more likely than older learners to report family commitments as reasons for non-attendance. More younger learners had missed school in the last two weeks because:
- they had a whānau/family event (12 percent Year 4 to 6, 6 percent Year 11 to 13)
- were on holiday (13 percent of Year 4 to 6 learners, 5 percent of Year 11 to 13).
… or because of being worried about going to school
Younger learners are more likely to want to miss school because they:
- are worried about catching Covid-19 (24 percent Year 4 to 6, 8 percent Year 11 to 13)
- get bullied or picked on at school (12 percent Year 4 to 6, 6 percent Year 11 to 13).
Parents of older learners
Parents of older learners are more likely to keep their child home due to mental health or bullying issues….
Parents of older learners are more likely to keep their child out of school:
- if their child is being bullied (42 percent Year 11 to 13, 34 percent Year 4 to 6)
- if their child has mental health challenges/anxiety (54 percent Year 11 to 13, 40 percent Year 4 to 6).
More parents of older children kept their child out of school in the last term because their child had mental health challenges (14 percent Year 11 to 13, 7 percent Year 4 to 6).
…or if their child needed to work
Parents of older learners are more likely to keep their child of out of school if their child needed to work in a paid job (10 percent year 11-13, 3 percent year 4-6). This reflects that more learners work when in secondary school.
Older learners
Older learners are less positive about school
Older learners are more likely to want to miss school because of a lack of engagement with school.
Older learners are more likely to not want to go to school. They are more likely to:
- want to miss school because they do not like getting up in the morning or are tired (44 percent Year 11 to 13, 28 percent Year 4 to 6)
- have missed school in the last two weeks because they didn’t feel like going (34 percent Year 11 to 13, 12 percent of Year 4 to 6).
Older learners are more likely to not be interested in what is taught at school. They are more likely to:
- want to miss school because they don’t like or are not interested in what is taught (30 percent Year 11 to 13, 6 percent Year 4 to 6).
Older learners are more likely to want to miss certain activities. They are more likely to:
- want to miss school because they don’t want to participate in certain activities (26 percent Year 11 to 13, 14 percent Year 4 to 6)
- have missed school in the last two weeks because they want to avoid something at school (12 percent Year 11 to 13, 4 percent Year 4 to 6).
Older learners are more likely to and want to do other activities. They are more likely to:
- want to miss school because they had something more enjoyable to do at home (44 percent Year 11 to 13, 22 percent in Year 4 to 6)
- have missed school in the last two weeks because they are doing another activity (13 percent Year 11 to 13, 4 percent Year 4 to 6).
Figure 66: Percentage of learners across different years who want to miss school because they aren’t interested or don’t like what is taught in school
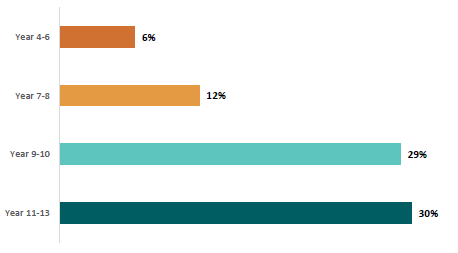
Figure sixty-six is a graph showing the percentage of learners across different years who want to miss school because they aren’t interested or don’t like what is taught in school.
The percentage for Year 4 to 6 learners were 6%.
The percentage for year 7 to 8 learners were 12%.
The percentage for year 9 to 10 learners were 29%.
The percentage for year 11 to 13 learners were 30%.
Older learners are more discouraged from attending school because of poor relationships with teachers and peers
Older learners are more likely than younger learners to want to miss school because they don’t like at least one of their teachers (22 percent Year 11 to 13, 7 percent Year 4 to 6) or they don’t like the people in their class (18 percent Year 11 to 13, 8 percent Year 4 to 6).
Older learners are more motivated to attend school to avoid getting into trouble
Older learners are more likely than younger learners to want to go to school because they would get into trouble if they don’t go (40 percent Year 11 to 13, 11 percent Year 4 to 6).
2. Socio-economic (decile)
Parents of learners in low decile schools
Parents of learners in low decile schools are more likely to keep their child home for sickness, lack of motivation, bullying and family events
Parents of learners in low-decile schools (decile 1 to 3) are more likely than those at high decile schools (decile 8 to 10) to keep their child out of school for:
- sickness – both for a minor illness (71 percent in low decile, 62 percent in high decile) and a chronic illness (68 percent in low decile compared to 58 percent in high decile)
- lack of motivation – if their child is tired (19 percent in low decile, 8 percent in high decile) and when their child doesn’t want to go to school (9 percent in low decile, 5 percent in high decile)
- bullying – if their child is being bullied (46 percent in low decile 35 percent in high decile)
- events - to attend a whānau/family/cultural or special event (71 percent in low decile compared to 64 percent in high decile).
Parents of learners in low decile schools experience more financial barriers
Parents of learners in low-decile schools face more barriers to attendance due to hardship or lacking resources. Parents of learners in low-decile schools are more likely to keep their child out of school if their child:
- has transport challenges (17 percent in low decile, 6 percent in high decile)
- doesn’t have the right equipment (18 percent in low decile compared to 8 percent in high decile)
- works at a paid job (11 percent in low decile compared to 5 percent in high decile).
Figure 67: Percentages of parents of learners in different decile schools who would be likely or very likely not to send their child to school for reasons associated with financial barriers
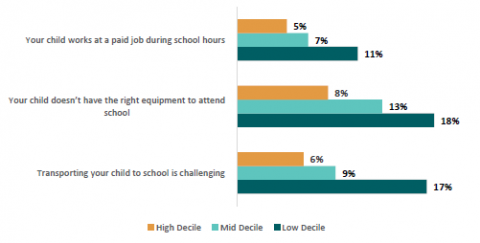
Figure 67 graph showing the percentage of parents of learners in different decile schools who would be likely or very likely not to send their child to school for reasons associated with financial barriers.
5% parents of learners in high decile schools would be likely or very likely not to send their child to school for ‘your child works at a paid job during school hours.’
7% parents of learners in mid decile schools would be likely or very likely not to send their child to school for this reason.
11% parents of learners in low decile schools would be likely or very likely not to send their child to school for this reason.
8% parents of learners in high decile school would be likely or very likely not to send their child to school for ‘your child doesn’t have the right equipment to attend school.’
13% and 18% parents of learners in mid and low decile schools would be likely or very likely not to send their child to school for this reason.
6% parents of learners in high decile schools would be likely or very likely not to send their child to school for ‘transporting your child to school is challenging.’
9% and 17% parents of learners in mid and low decile schools would be likely or very likely not to send their child to school for this reason.
Learners in low decile schools
Learners in low decile schools value attendance more
Learners in low decile schools are:
- more likely to think that going to school every day is important or very important (78 percent in low decile, 61 percent in high decile)
- almost twice as likely to want to go to school five days a week (61 percent in low decile, 33 percent in high decile)
- feel more motivation from their family to attend school (74 percent of learners in low-decile schools feel whānau are proud of them when they went to school, 65 percent in high-decile).
Learners in low decile schools feel more supported at school
Learners in low-decile schools are more likely to want to go to school because they:
- get to talk to an adult they trust (17 percent in low decile, 8 percent in high decile)
- get food at school (24 percent in low decile, 8 percent in high decile)
- think school is better than staying at home (36 percent in low decile, 17 percent in high decile).
Learners in low-decile schools are more likely to agree or strongly agree that:
- their school cares if they go to school (83 percent in low decile, 73 percent in high decile)
- they have an adult at school that really cares about them (56 percent in low decile, 46 percent in high decile).
Figure 68: Percentages of learners in different decile schools who agree or strongly agree with relationship motivators to attend school
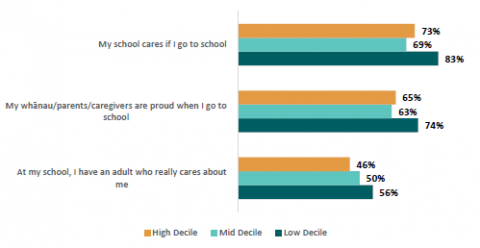
Figure sixty-eight is a graph showing the percentages of learners in different decile schools who agree or strongly agree with relationship motivators to attend school.
73% learners in high decile schools agree or strongly agree with the first motivator: ‘my school cares if I go to school.’,
69% learners in mid decile schools agree or strongly agree with this motivator.
83% learners in low decile schools agree or strongly agree with this motivator.
For the second motivator: ‘my whānau or parents or caregivers are proud when I go to school.’, 65% learners in high decile schools agree or strongly agree.
63% learners in mid decile schools agree or strongly agree with this motivator.
74% learners in low decile schools agree or strongly agree with this motivator.
For the third motivator: ‘at my school, I have an adult who really cares about me.’, 46% learners in high decile schools agree or strongly agree.
50% learners in mid decile schools agree or strongly agree with this motivator.
56% learners in low decile schools agree or strongly agree with this motivator.
Learners in low decile schools are more likely to miss school due to family commitments
Learners in low-decile schools are:
- twice as likely to want to miss school if they have whānau/family/cultural/special events on during school time (23 percent in low decile, 12 percent in high decile)
- twice as likely to want to miss school to look after sick or younger family members (11 percent in low decile, 5 percent in high decile)
- three times more likely to have missed school in the last two weeks for a whānau/family event (21 percent in low decile, 6 percent in high decile).
Learners in low decile schools are more worried about Covid-19
Learners from low-decile schools are:
- twice as likely to want to miss school if they are worried about catching Covid-19 (21 percent in low decile, 12 percent in high decile).
This is most likely due to lower socio-economic households housing more people and therefore the risk of spreading Covid-19 is greater to these individuals.
Learners in low decile schools are more likely to not have what they need to go to school
Learners from low-decile schools are much more likely to report they do not always have what they need to go to school (for example, uniform, shoes, jacket, lunch) (21 percent in low decile, 9 percent in high decile).
Learners from high decile schools
More learners from high decile schools lack motivation to go to school
Learners in high decile schools are more likely to want to miss school:
- if they have something more enjoyable to do at home (40 percent in high decile, 22 percent in low decile)
- if they don’t like getting up in the morning due to tiredness (38 percent in high decile, 27 percent in low decile)
- if they do not like or are not interested in what is taught (26 percent in high decile, 9 percent in low decile)
- if they don’t like at least one of their teachers (22 percent in high decile, 8 percent in low decile).
Figure 69: Percentages of learners in different decile schools who want to miss school for reasons associated with lacking motivation
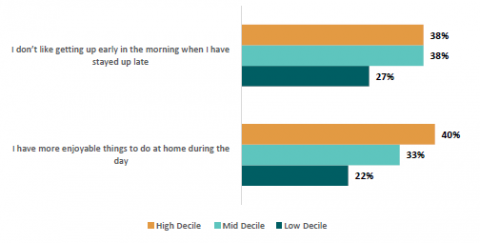
Figure sixty-nine is a graph showing the percentage of learners in different decile schools who want to miss school for reasons associated with lacking motivation.
The first reason is ‘I don’t like getting up early in the morning when I have stayed up late.’.
38% learners in high decile schools want to miss school for this reason.
38% learners in mid decile schools want to miss school for this reason.
27% learners in low decile schools want to miss school for this reason.
The second reason is ‘I have more enjoyable things to do at home during the day.’
40% learners in high decile schools want to miss school for this reason.
33% learners in mid decile schools want to miss school for this reason.
22% learners in low decile schools want to miss school for this reason.
3. Disability
Parents of disabled learners
Parents of disabled learners are more likely to keep their child out of school due to resource barriers
Parents of disabled children are more likely to keep their child out of school:
- if their child is unable to participate in a school activity (28 percent compared to 15 percent of parents of non-disabled children)
- if they do not have the right equipment (27 percent compared to 11 percent of parents of non-disabled children)
- if they have difficulty transporting their child to school (17 percent compared to 9 percent of parents of non-disabled children).
Figure 70: Percentages of parents of disabled and non-disabled learners who are likely or very likely to keep their child out of school if their child was unable to participate in a school activity
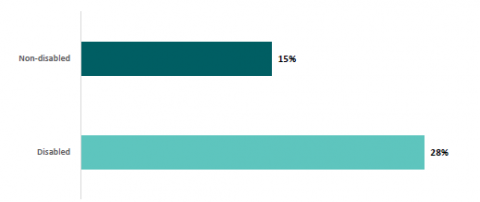
Figure seventy is a graph showing the percentages of parents of disabled and non-disabled learners who are likely or very likely to keep their child out of school if their child was unable to participate in a school activity.
The percentage for parents of non-disabled learners are 15%.
The percentage for parents of disabled learners are 28%.
Parents of disabled learners are more likely to keep their child out of school for health and wellbeing concerns
Parents of disabled children reported their child had missed school in the last term because:
- they had a chronic illness (19 percent of parents of disabled children, 10 percent of parents of non-disabled children)
- they had mental health challenges/anxiety (35 percent of parents of disabled children, 7 percent of parents of non-disabled children).
Parents of disabled learners are also more likely to keep their child home if:
- they are being bullied (47 percent of parents of disabled children compared to 36 percent of parents of non-disabled children). Worryingly, 12 percent of parents of disabled children had kept them home for this reason in the last term compared to 3 percent of parents of non-disabled children
- their child doesn’t want to go to school (11 percent of parents of disabled children compared to 6 percent of parents of non-disabled children).
Disabled learners
Disabled learners face more barriers to participating at school
Disabled learners are more likely to want to miss school because:
- they can’t participate in some activities at school (14 percent of learners with disabilities, 3 percent of learners without disabilities)
- they don’t want to participate in certain activities at school (31 percent of learners with disabilities, 20 percent of learners without disabilities)
- their schoolwork is too hard (27 percent of learners with disabilities compared to 11 percent of learners without disabilities).
Disabled learners are also less likely to be motivated to go to school because they don’t get to do activities such as sports and clubs (25 percent of disabled learners, 43 percent of non-disabled learners). They are more likely to not have everything they needed to go to school (19 percent of learners with disabilities compared to 11 percent of learners without disabilities).
Disabled learners are more likely to experience bullying
Disabled learners are more likely to miss school because they get bullied or picked on (20 percent of disabled learners, 8 percent of non-disabled learners). They are also more likely to have missed school in the last two weeks because they didn’t feel like being around their classmates (11 percent of disabled learners, 4 percent of non-disabled learners).
Disabled learners have lower engagement and connection to school
Disabled learners are less likely to:
- think going to school every day is important or very important (57 percent disabled learners, 68 percent non-disabled learners)
- feel their whānau are proud when they go to school (58 percent of disabled learned, 68 percent of non-disabled learners)
- want to go to school because they can see how school can help them in the future (41 percent of disabled learners, 56 percent of non-disabled learners)
- want to go to school because they like or are interested in what is taught at school (27 percent of disabled learners, 39 percent of non-disabled learners)
- feel that their school cares if they went to school (65 percent of disabled learners, 75 percent of non-disabled learners).
Figure 71: Percentages of disabled and non-disabled learners who agree or strongly agree that their school cares if they go to school
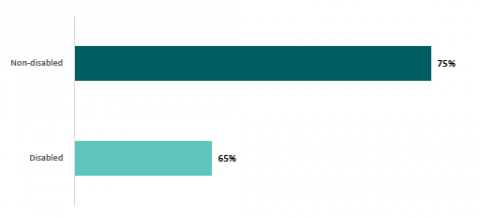
Figure seventy-one is a graph showing the percentages of disabled and non-disabled learners who agree or strongly agree that their school cares if they go to school.
The percentage for non-disabled learners is 75%.
The percentage for disabled learners is 65%.
4. Rurality
Parents in rural areas are more likely to take holidays in term time
Rural parents are more likely to:
- keep their child out of school if they go on a short holiday of one to two days (59 percent of rural parents, 43 percent of main urban parents)
- to have kept their child out of school in the last term because they went on a whānau/family holiday for one or two days (16 percent of rural parents, 9 percent of main urban parents).
Figure 72: Percentages of parents from main urban area and rural area who are likely or very likely to keep their child out of school if they go on a whānau/family holiday for one or two days
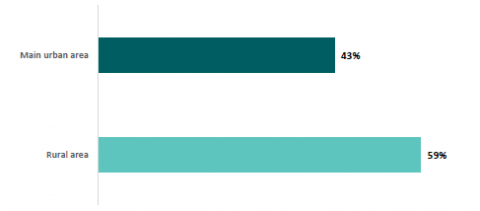
Figure seventy-two is a graph showing the percentages of parents from main urban area and rural area who are likely or very likely to keep their child out of school if they go on a whānau/family holiday for one or two days.
The percentage for parents from main urban area is 43%.
The percentage for parents from rural area is 59%.
We heard that this was often due to farming commitments not lining up with school holidays, with parents needing to take their children out for family holidays during the term time.
“Family holiday- it is quiet on the farm during term 1 during school” - Parent
Rural parents experience more transport barriers to attendance
Parents of rural learners were more likely to have kept their child out of school in the last term because transporting their child to school was challenging (8 percent of rural parents, 4 percent main urban parents). This is likely caused by the large distances between homes in rural areas and the nearest school and limited transportation options available in these areas.
5. Attendance patterns
Low attenders are less engaged with school
Low attenders are more likely to want to miss school because:
- they don’t like at least one of their teachers (22 percent low attenders, 11 percent high attenders)
- they don’t like the people in their class (20 percent low attenders, 11 percent high attenders)
- they don’t like or are not interested in what is taught at school (24 percent low attenders, 12 percent high attenders).
- they have more enjoyable things to do at home during the day (39 percent low attenders, 28 percent high attenders)
- they don’t want to participate in certain activities at school (25 percent compared to 16 percent).
The only reason that low attenders identified more than high attenders as a motivation for attending was because they would get into trouble if they don’t go (29 percent compared to 21 percent).
High attenders are more engaged
High attenders are:
- more likely to think school is important or very important for their future (85 percent high attenders, 72 percent for low attenders)
- more likely to think going to school every day was important or very important (77 percent high attenders, 57 percent low attenders)
- more likely to want to go to school five days a week (52 percent high attenders, 30 percent low attenders)
- more worried about catching up on school if they miss school (63 percent high attenders, 51 percent low attenders)
- more motivated to go to school because they like or are interesting in what is taught (41 percent high attenders, 31 percent low attenders).
High attenders are more supported to attend
Those with high attendance are more likely to:
- think their whānau are proud of them when they go to school than those with low attendance (70 percent compared to 61 percent)
- to have an adult at school who really cares about them (52 percent compared to 46 percent).
Figure 73: Percentages of low and high attenders who want to miss school for reasons associated with prioritising other activities
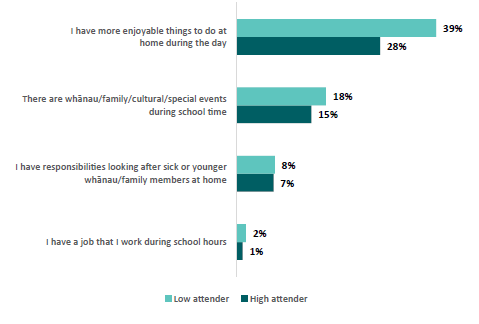
Figure seventy-three is a graph showing the percentages of low and high attenders who want to miss school for reasons associated with prioritising other activities.
The first reason is ‘I have more enjoyable things to do at home during the day.’
39% low attenders want to miss school for this reason.
28% high attenders want to miss school for this reason.
The second reason is ‘there are whānau or family or cultural or special events during school time.’
18% low attenders want to miss school for this reason.
15% high attenders want to miss school for this reason.
The third reason is ‘I have responsibilities looking after sick or younger whānau or family members at home.’
8% low attenders want to miss school for this reason.
7% high attenders want to miss school for this reason.
The fourth reason is ‘I have a job that I work during school hours.’
2% low attenders want to miss school for this reason.
1% high attenders want to miss school for this reason.
Figure 74: Percentages of low and high attenders who want to miss school for reasons associated with barriers to attendance
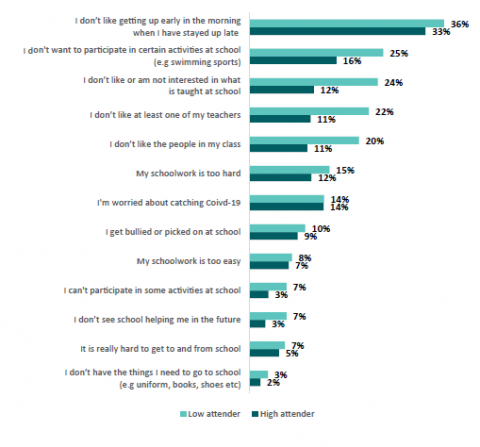
Figure seventy-four is a graph showing the percentages of low and high attenders who want to miss school for reasons associated with barriers to attendance.
The first reason is ‘I don’t like getting up early in the morning when I have stayed up late.’
36% low attenders want to miss school for this reason.
33% high attenders want to miss school for this reason.
The second reason is ‘I don’t want to participate in certain activities at school, for example, swimming sports.’
25% low attenders want to miss school for this reason.
16% high attenders want to miss school for this reason.
The third reason is ‘I don’t like or am not interested in what is taught at school.’
24% low attenders want to miss school for this reason.
12% high attenders want to miss school for this reason.
The fourth reason is ‘I don’t like at least one of my teachers.’
22% low attenders want to miss school for this reason.
11% high attenders want to miss school for this reason.
The fifth reason is ‘I don’t like the people in my class.’
20% low attenders want to miss school for this reason.
11% high attenders want to miss school for this reason.
The sixth reason is ‘my schoolwork is too hard.’
15% low attenders want to miss school for this reason.
12% high attenders want to miss school for this reason.
The seventh reason is ‘I am worried about catching covid 19.’
14% low attenders want to miss school for this reason.
14% high attenders want to miss school for this reason.
The eighth reason is ‘I get bullied or picked on at school.’
10% low attenders want to miss school for this reason.
9% high attenders want to miss school for this reason.
The ninth reason is ‘my schoolwork is too easy.’
8% low attenders want to miss school for this reason.
7% high attenders want to miss school for this reason.
The tenth reason is ‘I can’t participate in some activities at school.’
7% low attenders want to miss school for this reason.
3% high attenders want to miss school for this reason.
The eleventh reason is ‘I don’t see school helping me in the future.’
7% low attenders want to miss school for this reason.
3% high attenders want to miss school for this reason.
The twelfth reason is ‘it is really hard to get to and from school.’
7% low attenders want to miss school for this reason.
5% high attenders want to miss school for this reason.
The thirteen reason is ‘I don’t have the things I need to go to school, for example, uniform, books and shoes etc.’
3% low attenders want to miss school for this reason.
2% high attenders want to miss school for this reason.
Figure 75: Percentages of high and low attenders who want to go to school for each of the following reasons
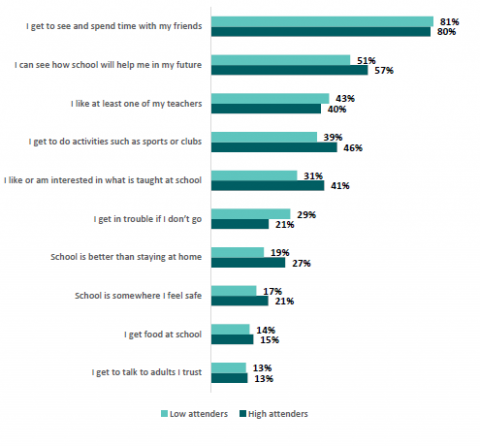
Figure seventy-five is a graph showing the percentages of high and low attenders who want to go to school for each of the following reasons.
The first reason is ‘I get to see and spend time with my friends.’
81% low attenders want to go to school for this reason.
80% high attenders want to go to school for this reason.
The second reason is ‘I can see how school will help me in my future.’
51% low attenders want to go to school for this reason.
57% high attenders want to go to school for this reason.
The third reason is ‘I like at least one of my teachers.’
43% low attenders want to go to school for this reason.
40% high attenders want to go to school for this reason.
The fourth reason is ‘I get to do activities such as sports or clubs,’
39% low attenders want to go to school for this reason.
46% high attenders want to go to school for this reason.
The fifth reason is ‘I like or am interested in what is taught at school.’
31% low attenders want to go to school for this reason.
41% high attenders want to go to school for this reason.
The sixth reason is ‘I get in trouble if I don’t go.’
29% low attenders want to go to school for this reason.
21% high attenders want to go to school for this reason.
The seventh reason is ‘school is better than staying at home.’
19% low attenders want to go to school for this reason.
27% high attenders want to go to school for this reason.
The eighth reason is ‘school is somewhere I feel safe.’
17% low attenders want to go to school for this reason.
21% high attenders want to go to school for this reason.
The ninth reason is ‘I get food at school.’
14% low attenders want to go to school for this reason.
15% high attenders want to go to school for this reason.
The tenth reason is ‘I get to talk to adults I trust.’
13% low attenders want to go to school for this reason.
13% high attenders want to go to school for this reason.
|
Differences within a school What drives the decision to miss school depends on the circumstance of the learner. To see how this happens within a school, we looked at the drivers of non-attendance in one large, single sex mid-decile school. The main motivators for learners to attend this school was getting to spend time with their friends, understand how important school is for their future, liking their teachers and being interested in what is taught in school. However, within this school we found that half the learners did not think attending every day was that important. Like we saw nationally, we found that there are groups of learners within the school that faced barriers to attendance. The most common barriers within the school are:
But there are also a sizeable number of learners who said the following are barriers to attending:
And a small group mentioned:
This local example shows that schools need to a range of strategies to encourage attendance and bring down barriers to attendance. |
Conclusion
There are many different reasons why different groups of learners miss school. Parents of younger learners tend to be more relaxed about their children missing school for holidays and value school for the fun their children have at school, whereas parents of older learners are more inclined to let their children miss school for their wellbeing or to go to work. Younger learners valued school highly and felt connected to their school and teachers. Older learners are more disengaged with school and experienced more social challenges but are more influenced by the prospect of getting into trouble.
Parents of learners in low decile schools experienced many more barriers to attendance such as sickness, bullying, and lacking resources. Learners in low decile schools are more engaged with learning and value school attendance more highly than learners in high decile schools.
Parents of disabled learners experience barriers to their child attending school, including higher levels of bullying.
The barriers and motivators mentioned in this section of the report matter. Learners that attended school regularly have more motivating factors. Learners that do not attend regularly have more barriers.
Part 9: What would help to improve attendance?
Schools or parents can’t improve attendance alone. Learner, family, school, and community factors all impact on attendance. Action is needed by government, communities, schools, parents, and learners for attendance in Aotearoa New Zealand to improve.
This report has found that:
- many parents and students do not understand the importance of regular attendance or the importance of school
- many parents and students are choosing to prioritise other things
- learners face real barriers to going to school and some groups of parents and learners face more barriers than others
- relationships and seeing the connection between education and the future are the biggest motivators for learners to attend school, but different groups of learners have different motivators.
Based on these findings, as well as what learners, parents and schools have told us will help, and examples of good practice, this section identifies five areas to help improve attendance.
Area 1: Increase understanding of the importance of attendance (and education).
Area 2: Increase school, learner, and parent awareness of how often learners are attending school.
Area 3: Make what and how learners learn more engaging and support them to catch up.
Area 4: Make school a great place to be.
Area 5: Tackle barriers to attendance.
Area 1: Increase understanding of the importance of attendance (and education)
Too many parents are comfortable with their child not attending school and too many learners are comfortable with not attending school. Every day of non-attendance has a negative impact on learning and achievement. Increasing the understanding of the importance of attendance and education is critical to changing this attitude.
What can help?
Learners
Learners told us that greater school and parent expectations for attendance would motivate them to attend school. Our findings showed that learners are more likely to value school and attendance if their school and their parents cared that they attended.
“Maybe if they got more encouragement from the school/ parents/caregivers” – Secondary learner
Parents
Parents told us they want clearer, more consistent messages about regular school attendance, including messages on the importance of attendance and the risks of irregular attendance.
“A lot falls on parents, parents need to see the value and see that attendance impacts learning. Recognizing the detrimental effect of not being there. Parents’ understanding is so important. Reading the 90 percent statistics - 10 percent absence is a month away a year. That kind of information is powerful. Educating parents so they in turn don’t take the easy way out for their kids. This will ultimately change children’s attitudes.” - Parent
“I believe they should be going to school. We are an immunocompromised family. I was worried about that. Secondary schools aren’t providing enough feedback. Communication is lacking.” - Parent
Schools
Schools told us they know that they need to reset expectations for regular school attendance with their school communities. They said that national messaging would support them to do this.
“There needs to be a national promotion of attending school so that parents see it everywhere. As a kāhui ako we are looking at doing something” – School leader
“Parents do take note of messages from Ministry - more of the messaging that says that school is a safe place to be - positive messaging; to counter the misinformation that is circulating. It works.”– School leader
“There is a need to have a refocus on attendance as a school and community” – School leader
|
Practice example: Working together to set an expectation of school attendance Concerned about the level of attendance across their schools, Northland schools have joined together to send a unified message about the importance of school attendance. Let’s Get to School Tai Tokerau| I Te Tai Tokerau – Hoake tatou ki te kura involved 150 schools in Northland receiving a social media kit containing posters, graphics, and key messages to use on their Facebook pages and websites. The initiative has received funding and support from the regional office of the Ministry of Education. President of the Te Tai Tokerau Principals’ Association Pat Newman said the collaboration came about after realising that lack of attendance at school was an issue that all schools were facing and that they could have a stronger response if they pooled resources and acted collectively. He said the campaign was designed to focus on the positive reasons for attending school from learners’ perspectives and in learners’ words. “The emphasis is on what learners enjoy about school and to raise awareness of what they might be missing out on by not being at school.’’ One month following the launch of the campaign Ministry attendance data showed a near 2 percent rise in the percentage of learners attending school in the region. This equates to nearly 500 more learners attending school. |
|
Practice example: All in for learning |Kia Kotahi te ū ki te ako In response to the decline in regular attendance, the Ministry of Education has developed and released an attendance and engagement strategy called All in for learning |Kia kotahi te ū ki te ako26. The strategy sets targets to raise regular attendance levels to 75 percent by 2026. The strategy has five priorities for the Ministry and schools:
In addition, in August 2022, the Ministry launched a national communications campaign aimed at promoting regular school attendance called Every school day is a big day. |
RecommendationsTo improve understanding of the importance of regular attendance we recommend the following actions.
|
Area 2: Increase school, parent, and learner awareness of how often learners are attending
Despite having the same expectations for school attendance as other countries (90 percent), a lower proportion of learners attend school regularly in Aotearoa New Zealand than United Kingdom, Ireland, Canada, the United States, and Australia.
From our focus groups and interviews with schools we found that schools have systems that communicate attendance to parents. However, these tools and systems require proactive parents or provide the information too late for parents to support learners to make changes. Many schools publish attendance data on web portals that parents have to look up, or in school reports at the end of term.
Not all schools have systems that look at attendance patterns. In addition to this, not all schools know about how often individual learners are attending, which learners have worrying levels of attendance, and how many learners have worrying levels of attendance.
Schools also have variable expectations for regular attendance – some told us they encourage a regular attendance rate less than 90 percent. Most schools follow up on moderate (70 to 80 percent attendance) and chronic non-attendance (less than 70 percent attendance). This means that many learners and their parents may not be aware when they are falling into irregular absence (80 to 90 percent).
What can help?
Learners
Learners told us that more prompts can help motivate them to attend. For example, for learners in one school, regular attendance is required to gain a junior diploma. Tutor teachers talked to learners frequently about the importance of regular attendance and show them how to track their attendance using the school’s online learner portal.
Parents
Parents told us they want more communication from schools about their child’s attendance.
“More communication. A mid-year report and end of year report is too late to change habits or results. We need more feedback about how things are going.” – Parent
“Support for learners, especially at this time due to the disruptions of COVID. Schools are really stretched. They don’t always get the message out when learners aren’t there. They need to work more closely with the parents and community about why they aren’t attending, how can we help the kids.’” - Parents
Schools
We saw the following practices that support awareness of attendance levels:
- senior leaders with responsibility for monitoring and reporting on attendance across the school
- clear expectations for pastoral staff and teachers to promote and follow up attendance with parents and learners
- strengthened reporting on learners’ overall attendance to parents in a range of ways (including in-person, online, and in formal school reports).
“We get a lot of attendance data. Weekly we look at attendance for each year level. It is shared with the DP (deputy principal), deans and ako teachers for year level and communication goes home. Subject teachers, ako teacher and dean may contact home or can escalate to DP” - School leader
|
Practice example: Change in attendance monitoring drives improvements The leader of a primary school was shocked when the school changed from monitoring and setting goals for attendance using the average across all the learners to the proportion of learners attending 90 percent of the time. “Before 2019 we were very proud of our high attendance rate – we sat at 90 percent. Then as a Kāhui Ako we started looking the proportion of learners attending 90 percent of the time. We did an inquiry and found that only 48 percent of our learners were attending regularly.” The leader initiated a school-wide inquiry into the drivers of attendance, with a focus on raising awareness of attendance amongst parents and learners. “In every whānau hui we talked about attendance rates. In our newsletter and through our parent portal – so that parents knew about the importance of 90 percent attendance.” “The guts of it was that most of our parents didn’t track their child’s attendance and we wanted to change that”. At the same time the school trialled recognising regular attendance with a certificate for learners. This was well received by learners and parents, and contributed to raised awareness levels of attendance across the school. |
Recommendations:To improve awareness of how often learners are attending school, we recommend the following actions.
|
Area 3: Make what and how learners learn more engaging
A group of learners are not finding school engaging. Just under one in five learners are not interested in what is being taught at school or want to avoid certain school activities. Māori learners and disabled learners are less likely to want to go to school because curriculum, teaching, and learning are preparing them for the future.
A number of school leaders agreed that schools face the ongoing challenge of making teaching and learning more personalised, engaging, and relevant.
What can help?
Learners
Learners told us they want a more engaging and relevant school curriculum – linked to life skills and their aspirations.
“Make subjects more relevant to life skills you need” - Learner
“Be able to pick more subjects at a younger age – having more subject choices” - Learner
“Make learning not so boring – for example have more practical based work” - Learner
They also want teachers to use a variety of teaching approaches and adapt for different learning styles.
“Teachers taking more time to explain things and help us out – sometimes they just give the work to us and say it is all there – but we are waiting for them to show us” - Learner
“They expect us to learn how they want to teach us.” - Learner
“Less taking notes and then tests. They need to break it up with fun/interactive things. More variety in class.” - Learner
Parents
Parents also told us they want schools to provide a more engaging and relevant curriculum.
“More of the life skills learning opposed to academic stuff. Would enhance school. Relevant life experience stuff” - Parent
“A curriculum that is more targeted at what kids actually love to do – what they are interested in. Some are not the best at maths, English or science. So do a focus group to understand what the kids are really good at and help grow that”. - Parent
Schools
Schools told us that the onus is on them to design and provide an engaging and relevant curriculum and to ensure learners experience effective teaching.
“Solutions have to come from schools changing the way we approach curriculum content and delivery. I don’t think we can depend on learners to intrinsically see the value of education – we have to make them want to come.” - School leader
“First we have to provide a rich, robust high knowledge, engaging curriculum.”- School leader
|
Practice example: Maximising opportunities to learn The principal of a low decile high school was aware of the social and economic pressures on the learners in his school and their families and whānau. He focused on building a culture of care in his school that recognised that every day at school matters. The school’s strategies included a focus on positive relationships, high expectations, meeting social needs, and attending to learners’ learning needs when they were at school. “We focused on the principle that ‘when they turn up to class – I am ready to teach them’. This led to a change of attitude from ‘oh you turned up – you are so far behind’ to ‘you’re here and this is what we are going to do and where we are going to get to’”.
|
Recommendations:To make learning more engaging we recommend the following actions.
|
Area 4: Make school a great place to be
Both parents and learners value the opportunities school provides for learners to develop social skills and socialise with friends. Positive relationships with teachers also motivate learners to attend school.
Bullying puts off four in 10 parents from requiring their child to attend school. Bullying also impacts one in 10 learners’ school attendance. Negative social interactions with peers and teachers also put learners off attending school. Māori and Pacific parents are especially concerned about schools’ social and emotional environments. Re-enforcing the importance of implementing Ka Hikitia, the Action Plan for Pacific Education and the NELP’s requirements that schools are fostering inclusive school cultures that ensure all learners and their whānau and families are free of racism and discrimination.57,58,59
What can help?
Learners
Learners told us schools can do more to promote a safe and positive social environment by improving responses to bullying, support for mental health, interactions with teachers, and addressing racism and discrimination.
“A safe school environment. More senior learners and teachers in a specific safe space to help with bullying” - Learner
“Learners would go to school more often if there were actually GOOD support systems there for them, and if their mental health issues were taken seriously by the school and their parents.” - Learner
“Teachers could be more reasonable when you make a mistake. They assume you will be trouble if you have done one thing wrong. They give up on kids too easily” - Learner
“Treat everyone the same – no matter their ethnicity” - Learner
Secondary-aged learners are frustrated with some traditional school practices including start times, seating plans, uniforms, and compulsory subject choices/activities.
“Make some activities optional – don’t force learners to do things they aren’t comfortable doing” - Learner
“More freedom in class- no seating plan by default” - Learner
“If school started later you would have less people sleeping in and people that live far away would have more time to get to school” - Learner
“Give us more independence – more like uni. Especially if we are getting the work done”. - Learner
Parents
Parents also think safe social environments and support for learners’ social and emotional skills is key to supporting attendance.
“An immediate issue learners are facing - bullying. MoE and schools need to be looking at this. There is a lot that needs to be done to stop this.” - Parent
“Kids feeling more supported at school. Teachers are really stretched but being in bigger classrooms with a lot of learners can cause learner to not engage with teachers or learning.” - Parent
“Identify earlier those learners that aren’t engaging in learning and find out why. Are they having any issues. Children are dealing with a lot these days. Not letting them get lost in a big group. Knowing that my child is supported at school takes the pressure off me” - Parent
Schools
Schools also identified that provision of a safe social and emotional learning environment is a foundation for encouraging attendance.
“A safe environment at school – if kids feel good they’ll come. A positive, safe learning environment. Somewhere they feel they are having their needs met – and a purpose to be here. If they feel there is no support, not listened to or respected – than they won’t want to come” - Teacher
“We run mentor groups of no more than 15 learners – so it is very visible when learners are not there. It’s about very strongly saying ‘I care about you – I care that you come to school.’” - School leader
|
Practice example: Social skills training The SENCO in this contributing primary school was concerned about increased levels of anxiety amongst parents and learners. This was leading to more learners staying home from school to avoid certain activities or stressors. The school participated in a pilot programme with the local Child and Adolescent Mental Health Service to deliver a resiliency programme called ‘Kia Maia’ (Be Brave). The programme taught strategies to manage anxiety. The programme was delivered to small groups of six to eight learners and the school saw good results with programme participants increasingly able to manage anxiety at school without going or staying home. The school continued delivering the programme beyond the pilot. The SENCO believes an important part of the programme’s success was that it gave parents confidence that the school knows about their child’s anxiety and is providing appropriate support. |
Recommendations:To make school a great place to be we recommend the following actions.
|
Area 5: Tackle barriers to attendance
A range of barriers lead parents to decide to keep their child at home, or learners to decide not to attend school. Schools and parents told us they cannot address the many barriers to attendance alone.
What can help?
Learners
Learners told us they want more help with and more understanding about the barriers they face in attending school.
“Some people don't have the money for bus fares, making it easier for learners to get to school will help. Also during winter when it is cold, some might stay home because they can't afford the proper school uniform and are not allowed to wear other warm clothes. Stopping the over-policing of uniform can help this, if not making uniforms cheaper, and more size inclusive.” - Learner
“Food, understanding about why a learner may not have correct uniform, decent teaching for less able learners, kindness towards learners” - Learner
“Free lunches in all schools...I know a lot of people go without lunch” - Learner
“More transportation to get to school, free transport options” - Learner
Parents
Parents also want more support for families struggling to overcome barriers to school attendance.
“There are people that struggle to fill a lunch box, and I know they’ve been bringing in lunch in schools. Both my boys went to counselling – they were always during school time. If that was within school time then they wouldn’t have to take a half day off school. When I was sick I couldn’t get kids to school, transport would be a huge help.” - Parent
“The cost of uniforms. If they are not dry or ready for the next day – the kids don’t want to go in the wrong pants or shoes. It would be cool if that was cheaper or subsidised.” - Parent
“Help with transport – that would save me $40 to $50 a week. School provides lunches. Seeing an increase in learners going to school because they are being fed. A square meal makes them feel better about themselves.” - Parent
“if we had a better school bus network here would be a huge benefit. With the drug issues and domestic violence here – if the kid can get on the bus with their friends then they might do that – even without a uniform and lunch.” - Parent
“I can understand why kids would have to stay home and look after siblings. Childcare can exceed wage. Parents don’t have enough choices. A lot of people don’t have a village or a community to help”. - Parent
Schools
Schools told us some of the barriers to attendance are not able to be addressed by school, and they needed the support of government and communities. Existing national programmes to reduce barriers, such as free lunches, free period products, Social workers in Schools, are making a difference.
“We would benefit from an attendance service – with the ability to form relationships with whānau and in the community – to door knock – we can’t afford that. Need to build understanding of the why behind non-attendance – there are huge things around trauma. We need counsellors, psychologists – the need for intensive care and work – many cases are beyond the capability of schools. We need people to support us.” - School leader
“we have the period products, the free lunches – they are reducing barriers. We spend lots of money buying clothing as well.” - School leader
“We already have breakfast club. Free lunch definitely helps for some. We don’t have a uniform – which may or may not help. Safe transport is quite a big one. We are just in the early stages of setting up an attendance service – getting the processes rolling. Oranga Tamariki and Social Workers in School has picked up some of the wrap around support for vulnerable families – schools can’t offer some of the social stuff that is needed to wrap around.” - School leader
|
Practice example: Meeting individual needs by removing barriers The principal of a primary school in a small town credits strong community connections and knowledge of school families as key to addressing attendance concerns. “Our region can be very wet, sometimes if children don’t have umbrellas, gumboots and coats they won’t come”. The school has worked closely with local churches and charities to fund wet weather gear as a way of removing this barrier to attending. “We know our families and their needs. An example is we have a local single-parent family struggling with transport to school. One of the children is already at school and the other is about to transition. So we pick up the whole family, bring the older child to school and drop the younger one to kindergarten. It’s just what we do here.” |
Recommendations:To tackle barriers to attendance we recommend:
|
Conclusion
Improving attendance in Aotearoa New Zealand requires action from everybody. It requires government agencies, including the Ministry of Education, to communicate the importance of attendance and set clear expectations to the community and to the families (including those that social agencies are working with).
Improving attendance requires schools to more proactively manage regular non-attendance, and to let parents know early when learners are missing school regularly. Schools need to make learning more engaging, teach the relevance and value of all learning, and make catch-up material available for learners who have missed learning.
It requires parents to set expectations for school attendance, and to work with schools to either overcome or find other ways to deal with issues that lead to non-attendance. Parents also need to support their learner to catch up on missed learning, either during school holidays, weekends or after school.
It requires learners to work with the school and their parents, to find ways to deal with issues that arise within the school. It also requires learners to take agency over their learning – and decide that attendance and doing well in school is important.
Regular attendance at school is critical to achievement and Aotearoa New Zealand’s future. We need to act now to change the trend of declining attendance.
Appendix 1: Methodology
ERO used a mixed method approach of surveys, focus groups and interviews. This report draws on student, parent, and school voices to understand the reason why students miss or go to school.
ERO used a mixed method approach for the data collection for this report. We collected both qualitative and quantitative data. The target population were English medium schools in New Zealand. Data was collected through surveys and focus groups, of students and parents, and interviews with teachers and school leaders.
Quantitative data were statistically analysed using STATA and Excel software. Meaningful differences between groups were identified by the magnitude of differences in percentages between groups. We looked for differences where: there was a greater than seven percentage points differences, where one group responded to a question at twice the rate of another group (for lower percentages) or where a difference meaningfully explained a particular factor. Non-responses and ‘don’t know’ responses were excluded from response totals when calculating percentages.
Qualitative data were thematically analysed by an experienced team.
Student survey
ERO conducted the student survey using Survey Monkey. The student survey was in the field from 23rd of June 2022 to 18th of August 2022 (spanning parts of both term 2 and term 3). We invited a random sample of 400 schools to participate in our survey, excluding schools that ERO had recently contacted for other surveys. Schools were sent the survey link in an email and invited to pass this on to their students. 48 schools contributed at least one response and we had a total of 2641 respondents.
Due to two large single sex secondary schools contributing considerably larger number of respondents to the respondent pool than other schools, we excluded some responses from these schools to avoid skewing the data. For these schools, we trimmed responses where students didn’t finish the survey and of those remaining, we removed a random sample of students to reduce each school’s contribution to no more than 9 percent of the total sample. This resulted in our sample reducing to 1893 respondents. We, however, did use one of the school’s full data for a case study within the report, so the removed responses still contributed to the overall report.
A full list of survey questions we asked parents can be found in Appendix 3.
Below is the breakdown of student participants:
|
Demographic |
Number |
Percentage |
Population percentages |
|
Māori |
420 |
22% |
25% |
|
Non-Māori |
1473 |
78% |
75% |
|
Pacific |
284 |
15% |
10% |
|
Non-Pacific |
1609 |
85% |
90% |
|
Female |
1018 |
54% |
49% |
|
Male |
797 |
42% |
51% |
|
Gender diverse/other |
52 |
3% |
Not reported |
|
Year 4 |
18 |
1% |
10% |
|
Year 5 |
329 |
17% |
10% |
|
Year 6 |
290 |
15% |
10% |
|
Year 7 |
204 |
11% |
12% |
|
Year 8 |
219 |
12% |
11% |
|
Year 9 |
174 |
9% |
10% |
|
Year 10 |
212 |
11% |
10% |
|
Year 11 |
184 |
10% |
9% |
|
Year 12 |
137 |
7% |
9% |
|
Year 13 |
126 |
7% |
8% |
|
Disabled |
158 |
8% |
Not reported |
|
Non- disabled |
1497 |
79% |
Not reported |
|
Decile 1-3 |
450 |
24% |
22% |
|
Decile 4-7 |
773 |
41% |
38% |
|
Decile 8-10 |
668 |
35% |
38% |
Population figures calculated from 2021 roll data and percentages are of all learners. Year level percentages are calculated as a percentage of learners in Years 4-13 only, to be consistent with the sample for the survey
Parents survey
ERO conducted the parent survey with the help of a survey panel recruitment company. We had a total of 1133 parents participate. The survey was in the field from 12 July 2022 to 5 August 2022. This spanned both the school holidays (9 July to 24 July) and term time (25 July onwards). The sample was as nationally representative as practical with both Māori and Pacific parents slightly boosted in the sample. As some parents had multiple children, we got all parents to select the age(s) of the child(ren). If they had more than one school aged child, one age was selected at random and the parents were informed to answer the survey from then on in relation to “their Year XX child.”
A full list of survey questions we asked parents can be found in Appendix 3.
Below is a breakdown of the parent participants:
|
Demographic |
Number |
Percentage |
|
Māori (parent) |
273 |
24% |
|
Non-Māori (parent) |
860 |
76% |
|
Pacific (parent) |
92 |
8% |
|
Non-Pacific (parent) |
1041 |
92% |
|
Female (parent) |
675 |
60% |
|
Male (parent) |
451 |
40% |
|
Gender diverse/other (parent) |
3 |
>1% |
|
Year 4 (child) |
121 |
11% |
|
Year 5 (child) |
117 |
10% |
|
Year 6 (child) |
116 |
10% |
|
Year 7 (child) |
118 |
10% |
|
Year 8 (child) |
114 |
10% |
|
Year 9 (child) |
115 |
10% |
|
Year 10 (child) |
109 |
10% |
|
Year 11 (child) |
108 |
10% |
|
Year 12 (child) |
111 |
10% |
|
Year 13 (child) |
104 |
9% |
|
Disabled (child) |
134 |
12% |
|
Non-disabled (child) |
946 |
83% |
|
Decile 1-3 |
236 |
22% |
|
Decile 4-7 |
444 |
41% |
|
Decile 8-10 |
402 |
37% |
|
Female (child) |
508 |
45% |
|
Male (child) |
595 |
53% |
|
Gender diverse/other (child) |
9 |
1% |
Parent focus groups
We conducted six parent focus groups with 37 participants in total. These were all held online. We recruited a nationally representative sample through a panel company which included a mix of male and females, parents of different aged children and from a geographical spread. We also ensured we had a range of ethnic representation and boosted Māori and Pacific participants. Māori and Pacific ERO staff conducted specific focus groups with just Māori and Pacific parents respectively. Focus groups were conducted between 20 July 2022 and 9 August 2022.
The questions we asked parents are set out below:
- How important is school attendance to you and why?
- Have your views on school attendance changed over time? How?
- When would you not send your child to school and why?
- In the last term what have been the reasons for keeping your child home?
- How do your children view school attendance?
- What encourages them to attend?
- What discourages your child from attending?
- What can be done to better support school attendance?
The focus groups were recorded, and extensive notes were taken. The notes were coded for key themes, and quotes were gathered from records.
Learner focus groups
ERO conducted 10 focus groups across five schools which included approximately 80 learners. These were all held in person. We included a mixture of male and female participants and covered both primary and secondary schools. We also intentionally included schools of a range of deciles and geographical locations within New Zealand and ensured we had a spread of ethnicities. We also conducted a specific focus group with a high proportion of Māori students which was led by experienced ERO Māori review staff. We conducted the focus groups between the 28 July 2022 and 16 August 2022. The questions we asked learners are set out below:
- How important is going to school regularly and why?
- What gets in the way, makes it hard, or discourages you from going to school?
- Thinking about the last term – why did you not go to school?
- What motivates you to attend school?
- What sorts of things are needed to encourage students to attend school regularly?
Learners were asked in groups to discuss the questions, and their answers were written up on large flipcharts in their own words. The learner focus groups were not recorded or transcribed.
Teacher and school leader interviews and focus groups
ERO talked to 41 teachers and school leaders from 33 schools through both focus groups and interviews. These were held both in person and on the phone. We conducted these between 20 July 2022 and 25 August 2022. We talked to a broadly representative sample of schools, and intentionally covered schools from a range of geographical locations and deciles.
The questions we asked leaders were:
- How regularly are you monitoring school attendance data and what do you do with it?
- Are you noticing any change in regular attendance?
- How concerned are you about attendance?
- What changes have you noticed in parent attitudes toward attendance?
- What expectations is the school communicating to the community about attendance?
- How do you communicate/promote regular attendance to students?
- What sorts of things are needed to help schools and families get students to school regularly?
The questions we asked teachers were:
- What motivates students to attend school and parents to send them?
- What discourages students from attending?
- What changes are you noticing in student/parent attitudes to attendance?
- What is the school’s expectations about attendance?
- How does the school communicate expectations?
- What would help schools and families to improve school attendance?
The focus groups were conducted with extensive notes taken. The notes were coded for key themes, and quotes were gathered from verbatim records.
As the findings from the teacher and school interviews and focus groups were consistent with the parent and learner surveys and interviews, this report focusses largely on the findings from parents and learners, and includes teachers’ and school perspective to aid understanding. Teacher and school ideas were drawn on to identify good practice and strategies that could help with attendance.
Limitations
As with all research, there are some limitations to our methodology.
Learner survey: Schools were able to choose the learners they passed the survey on to, and it is possible that learners who completed the survey were more likely to have regular attendance than the population. We checked this by comparing the reported regular non-attendance rate of learners in our sample with national figures. The non-attendance rate of learners in low decile school was lower than national figures.
Our parent survey and focus group samples were recruited from nationally representative panels. We bolstered our parent survey and focus groups to ensure sufficient sample from low incomes, Māori and Pacific parents. However, recruiting parents through the panel companies does limit our sample to only those who were signed up to such companies.
Our data collection occurred during the peak of the Omicron outbreak. As our findings show, sickness was a big barrier to attendance so collecting data at a time of high sickness would have influenced some of our results especially the self-reported attendance rates of students or their parents for Term 2.
Māori participation in the research
Māori learners are a key focus of this research (as set out in Part 6) and were made up 22 percent of survey respondents (compared to 25 percent of student population). Māori researchers facilitated a Māori whānau focus group and facilitated a Māori learners focus group. We ran a sense making session with Māori staff within ERO, using Ka Hikitia as a framework for discussion. This research is undertaken within English Medium schools, although Ministry of Education data includes Māori medium. Looking at attendance in Māori medium schools would need to be developed with Māori medium schools taking a Kaupapa Māori approach.
Appendix 2: Student survey questions
Demographics questions
- Which ethnic group(s) do you belong to? (You can choose more than one)
- New Zealand European/ Pākehā
- Māori
- Samoan
- Cook Island Maori
- Tongan
- Niuean
- Fijian
- Tokelauan
- Other Pacific Peoples
- Chinese
- Indian
- Other Asian
- Other European
- Middle Eastern
- Latin American
- African
- Southeast Asian
- Don’t know
- Prefer not to say
- Another ethnic group (please tell us)
- Are you?
- Female
- Male
- Gender diverse
- Prefer not to say
- Other
- What year are you in?
- Year 4
- Year 5
- Year 6
- Year 7
- Year 8
- Year 9
- Year 10
- Year 11
- Year 12
- Year 13
- What school do you go to?
- Do you have a long-term disability (lasting 6 months or more) (e.g. impaired hearing, visual impairment, in a wheelchair, learning difficulties)?
- Yes
- No
- Don't know
- Thinking about where you normally live, how often is a parent/caregiver at home during the day while you are at school?
- Always
- Often
- Sometimes
- Rarely
- Never
- Don't know
Multichoice questions
- How important do you think school is for your future?
- Very important
- Important
- Somewhat important
- Not that important
- Not at all important
- I don’t know
- How important do you think going to school every day is?
- Very important
- Important
- Somewhat important
- Not that important
- Not at all important
- I don’t know
- If it was only up to you (you wouldn't get in trouble with anyone), how many days a week would you go to school?
- 0 days
- 1 day
- 2 days
- 3 days
- 4 days
- 5 days (the whole week)
- Don't know
- How would you feel about catching up on schoolwork after missing one day of school?
- Very worried
- Worried
- Somewhat worried
- Not that worried
- Not at all worried
- Don't know
- How would you feel about catching up on schoolwork after missing one week of school?
- Very worried
- Worried
- Somewhat worried
- Not that worried
- Not at all worried
- Don't know
- How often do you feel like going to school? (even if you end up not going to school)
- Always
- Often
- Sometimes
- Rarely
- Never
- Don't know
- What are the main things that make you want to go to school? (choose all that apply)
- I like or am interested in what is taught at school
- I understand how important school is for my future
- I get to spend time with my friends
- I like at least one of my teachers
- I get to do activities like sports or clubs
- I get to talk to adults I trust
- School is better than staying at home
- School is somewhere I feel safe
- I get food at school
- I get in trouble if I don’t go
- I never feel like going to school
- Other (please specify)
- Below are the reason(s) you picked in the last question. Pick the most important reason(s) for you. (You can pick up to 3)
- I like or am interested in what is taught at school
- I understand how important school is for my future
- I get to spend time with my friends
- I like at least one of my teachers
- I get to do activities like sports or clubs
- I get to talk to adults I trust
- School is better than staying at home
- School is somewhere I feel safe
- I get food at school
- I get in trouble if I don’t go
- I never feel like going to school
- Other (please specify)
- How often do you feel like missing school? (even if you end up going to school)
- Always
- Often
- Sometimes
- Rarely
- Never
- Don't know
- What are the main things that make you want to miss school (when you aren't too sick or injured to go)? (choose all that apply)
- I don’t like or am not interested in what is taught at school
- I don’t see how school is important for my future
- My schoolwork is too hard
- My schoolwork is too easy
- I get bullied or picked on at school
- My friends skip school and want me to as well
- I don’t like at least one of my teachers
- I don’t like the people in my class
- It is really hard to get to and from school
- I don’t like getting up early in the morning when I have stayed up late (e.g playing video games or watching a movie)
- I have a (paid) job I work at during school hours
- I have to look after whānau/family members at home
- I'm worried about catching Covid-19
- I have more enjoyable things to do at home during the day (e.g be with whānau/family members, play games etc)
- There are whānau/family/cultural/special events during school time (e.g. birthday, funeral, tangihanga, weddings)
- I don’t have the things I need to go to school (e.g uniform, books, shoes etc)
- I can't participate in some activities at school because I don't have the support I need
- I don't want to participate in some activities at school (e.g swimming sports, prize giving)
- I never feel like missing school
- Other (please specify)
- Below are the reason(s) you picked in the last question. Pick the most important reason(s) for you. (You can chose up to 3)
- I don’t like or am not interested in what is taught at school
- I don’t see how school is important for my future
- My schoolwork is too hard
- My schoolwork is too easy
- I get bullied or picked on at school
- My friends skip school and want me to as well
- I don’t like at least one of my teachers
- I don’t like the people in my class
- It is really hard to get to and from school
- I don’t like getting up early in the morning when I have stayed up late (e.g playing video games or watching a movie)
- I have a (paid) job I work at during school hours
- I have to look after whānau/family members at home
- I'm worried about catching Covid-19
- I have more enjoyable things to do at home during the day (e.g be with whānau/family members, play games etc)
- There are whānau/family/cultural/special events during school time (e.g. birthday, funeral, tangihanga, weddings)
- I don’t have the things I need to go to school (e.g uniform, books, shoes etc)
- I can't participate in some activities at school because I don't have the support I need
- I don't want to participate in some activities at school (e.g swimming sports, prize giving)
- I never feel like missing school
- Other (please specify)
Agree-disagree questions
For these questions respondents could select from: Strongly agree, Agree, Somewhat agree, Somewhat disagree, Disagree, Strongly disagree, Don't know
- My whānau/parents/caregivers care if I go to school
- My school cares if I go to school
- My whānau/parents/caregivers are proud when I go to school
- At my school, I have an adult who really cares about me
Multichoice questions
- How often do you have everything you need to go to school (e.g clean uniform, shoes, rain jacket, lunch etc)
- Always
- Often
- Sometimes
- Rarely
- Never
- Don't know
- How many days have you been away from school in the last two weeks?
- None
- One day
- Two or more days
- Don't know
- Why didn't you go to school on that day(s)? (chose as many as apply)
- I was sick
- I was isolating (from Covid-19)
- I was afraid of being bullied or picked on at school
- I don’t like being around my classmates
- I don’t like my teacher
- I knew my friend(s) wouldn’t be at school
- I wanted to avoid something at school (e.g. a class, a sports day, a test, certain school work or homework )
- I didn’t have right equipment (e.g shoes, uniform, books etc)
- I couldn't get to and from school
- I was on holiday
- I was doing another activity (cultural, sporting etc)
- I had a whānau/family event (e.g. birthday, funeral, tangihanga)
- I had to work
- I visited or looked after a whānau/family member
- I or my parents were worried about me catching Covid-19
- I was suspended or stood down
- I didn't feel like going (e.g was too tired, would rather stay at home etc)
- Other (please specify)
- In the last term (since the Easter school holidays) how much school have you missed? (DO NOT count time spent learning from home while isolating)
- I have missed no days
- I have missed a couple of days (less than a week)
- I have missed about a week (but less than two weeks)
- I have missed about two weeks (but less than three weeks)
- I have missed about three weeks (but less than four weeks)
- I have missed four weeks or more
- I don’t know
Open text
- Why do you think some students in your school don’t go to school?
- What do you think would help students go to school more often?
- Please share anything else you want to tell us here
Appendix 3: Parents survey questions
Preliminary question
- Do you currently have children in any of the following years at school? Please tick all that apply
- Year 4 (typically this includes children aged 7-8 at the start of the school year)
- Year 5 (age 8-9 at the start of the school year)
- Year 6 (age 9-10 at the start of the school year)
- Year 7 (age 10-11 at the start of the school year)
- Year 8 (age 11-12 at the start of the school year)
- Year 9 (age 12-13 at the start of the school year)
- Year 10 (age 13-14 at the start of the school year)
- Year 11 (age 14-15 at the start of the school year)
- Year 12 (age 15-16 at the start of the school year)
- Year 13 (age 16-17 at the start of the school year)
- None of the above
Parents selected the age(s) of the child(ren). If they had more than one school-aged child, one age was selected at random and the parents were informed to answer the survey in relation to “their Year XX child.”
Importance questions
For these questions respondents could select from: Very important, Important, Somewhat important, Not that important, Not at all important, I don’t know.
- How important is it that your Year XX child goes to school every day?
- How important is school for your Year XX child’s future?
There are many reasons parents think going to school is important for their child, how important are the following reasons for you?
- School helps my child learn useful skills and knowledge
- School helps my child develop social skills
- School is fun for my child
- School is a place I can send my child during the day while I do other things (e.g. go to paid work, unpaid domestic or caring work, travel)
- The law says I have to send my child to school
Likelihood questions
For these questions respondents could select from: Very likely, Likely, Somewhat likely, Somewhat unlikely, Unlikely, Very unlikely, Don’t know.
How likely would you be to keep your Year XX child out of school if…
- Your child has a minor illness or injury e.g. sore tummy, headache, flu symptoms, sprained arm
- Your child has chronic illness or injury e.g. asthma, broken limb
- Your child has mental health challenges/anxiety
- Your child is tired
- You child doesn’t want to go to school
- Transporting your child to school is challenging
- Whānau/Family holiday for one or two days
- Whānau/Family holiday for one week or more
- Whānau/Family/cultural or special event such as Funeral, Tangihanga, Wedding
- Your child is being bullied
- You or another caregiver happen to be at home that day
- Your child looks after another whānau/family member(s)
- Your child works at a paid job (to earn money) during school hours
- Your child is participating in an out-of-school sporting event
- It’s your child’s birthday
- Your child is unable to participate in a school activity e.g. swimming, sports
- Your child doesn’t have the right equipment to attend school e.g. shoes, uniform, money for school events
Open text
- If there are other reasons you would be very likely or likely to keep your Year XX child at home, please list them here:
Multichoice questions
Keeping in mind there are normally 8-10 weeks (about 50 days) in a school term…
- How many total school days, spread out across a term, would you be comfortable with your Year XX child missing?
- 0 days
- A couple of days (less than a week)
- About a week (but less than two weeks)
- About two weeks (but less than three weeks)
- About three weeks (but less than four weeks)
- Four or more weeks
- Don’t know
- How many school days in a row would you be comfortable with your Year XX child missing in one term?
- 0 days
- 1-2 days
- 3-5 days
- 6-10 days
- 11-15 days
- 16-20 days
- 21-25 days
- 26 days or more
- Don’t know
- What learning areas would you be most concerned about your Year XX child missing? (Please tick all that apply)
- English (reading, writing, listening, speaking)
- The arts (drawing, painting, creating sculptures, dance, drama, music)
- Health and physical education (exercise, physical activity, mental health, sexuality education, food and nutrition, body care and physical safety, sport studies, outdoor education)
- Learning languages (communication, language knowledge and cultural knowledge)
- Mathematics (number and algebra, geometry and measurement, statistics)
- Science (planet earth and beyond, the living world, physical word-physics, material world-chemistry, topic, inquiry)
- Social science (identity, culture and communities, place and environment, the economic world, history and the present)
- Technology (digital design and creating readable diagrams, software development, programming)
- School events (such as swimming sports, athletics day, interschool competition)
- If your year xx child missed 1 day of school, how long would it take before they were back on track with their learning?
- They wouldn’t be behind on their learning after one day away
- They would be caught up on missed learning within half a day
- They would be caught up on missed learning after a day
- They would be caught up on missed learning after two days
- They would need more than two days to catch up on their missed learning.
- I don’t know
- How many school days during a term would your Year XX child need to miss for their learning to be negatively affected?
- 1-2 days
- 3-5 days
- 6-10 days
- 11-15 days
- 16-20 days
- 21-25 days
- 26 days or more
- Don’t know
- Does your Year XX child’s school actively encourage student attendance?
- Yes
- No
- Don’t know
Open text
- How?
Multichoice questions
- Does your Year XX child’s school let you know if they do not attend school (if you haven’t told them directly)
- Yes
- No
- Don’t know
Again please note, there are normally 8-10 weeks (about 50 days) in a school term…
- About how many school days has your child missed in term 2 (Between Easter school holidays and July the 8th) (for any reason except time spent learning from home while isolating)?
- 0 days
- A couple of days (less than a week)
- About a week (but less than two weeks
- About two weeks (but less than three weeks)
- About three weeks (but less than four weeks)
- Four or more weeks
- Don’t know
- What are the reasons your child did not go to school last term (term 2) (excluding time spent learning from home while isolating)? Please tick all that apply
- Your child has a minor illness or injury e.g. sore tummy, headache, cough or cold symptoms, sprained arm
- Your child has chronic illness or injury e.g. asthma, broken limb
- Your child had mental health challenges/anxiety
- Your child was tired
- You child didn’t want to go to school
- Transporting your child to school was challenging
- Whānau/Family holiday for one or two days
- Whānau/Family holiday for one week or more
- Whānau/Family/cultural or special event such as Funeral, Tangihanga, Wedding
- Your child was being bullied
- You or another caregiver happened to be at home that day
- You needed your child to look after another whānau/family members
- Your child worked at a paid job (to earn money) during school hours
- Your child was participating in an out-of-school sporting event
- It was your child’s birthday
- Your child was unable to participate in a school activity e.g swimming sports
- Your child didn’t have the right equipment to attend school e.g shoes, uniform, money for school events
- Other (please specify) …......
- Do you think attendance at your Year XX child’s school could be improved?
- Yes
- No
- Don’t know
Open text
- Please share any ideas you have about how attendance at your Year XX child’s school could be improved
Multichoice question
- Are you aware of whether your Year XX child’s school has improved attendance in the past?
- Yes
- No
- Don’t know
Open text
- What did your Year XX child’s school do (if anything) to improve attendance?
- If there is anything else you would like to share, please do so here:
Demographic questions
- How do you identify?
- Male
- Female
- Other
- I’d prefer not to say
- What school does your Year XX child go to?
- How do you identify (Please tick all that apply)?
- Māori
- Tokelauan
- Fijian
- Niuean
- Tongan
- Cook Islands Māori
- Samoan
- Other Pacific Peoples
- Southeast Asian
- Indian
- Chinese
- Other Asian
- Middle Eastern
- Latin America
- African
- Other European
- NZ European/Pākehā
- Other Ethnicity (please specify)
- How does your Year XX child identify?
- Male
- Female
- Other
- I’d prefer not to say
- Does your child have a long-term physical, mental, intellectual or sensory impairment or disability that impacts their ability to participate or learn at school?
- Yes
- No
- Prefer not to say
- Don’t know
- How often are you or another adult at home during the day while your child in Year XX is at school?
- Always
- Often
- Sometimes
- Rarely
- Never
- Don’t know
Appendix 4: Definitions
Schools measure attendance in two ways.
- Attendance rate is the percentage of half days a learner has attended out of the available half days in the period of time being reported on. This rate can be averaged across a group of learners – such as a year level or a school.
- Attendance level is the percentage of learners who attend at the expected rate – ie more than 90 percent of the time. It is important to note that even with a relatively high average attendance rate, a school may still have a low attendance level with a significant proportion of learners not attending regularly.
Appendix 5: What does the research say works to improve attendance?
Research shows that cross sector and community collaboration, partnerships with parents and whānau, effective use of attendance data and multiple, tailored school strategies are needed to foster a positive attendance culture across communities and schools and to address non-attendance.
Successful strategies often involve multifaceted programmes rather than single isolated practices and involve coordinated efforts across multiple service providers and partnerships with families.
1. Collaboration across government
Non-attendance can not to be solved by schools alone. Collaboration across Government departments and agencies and with local community groups and providers is needed to reduce the barriers that families and students experience to attending school (such as health, housing, transport, employment). Collaboration ensures that relevant supports and services are delivered to those who need it in a timely way.
2. Partnerships with parents and whānau
Building parent and whānau awareness of the importance of regular attendance and involving them in strategies to reduce non-attendance is critical to improving attendance.61,62 This is particularly important for primary-aged children whose attendance patterns are more likely to be parent-driven. Useful evidence-based approaches include: making home visits to families of chronically absent students; establishing a contact person at school for parents to work with; conducting workshops for families on attendance; referring students to support services and using an attendance officer to work with students and families on a consistent basis.63
3. Data informed strategies
Research64,65,66 emphasises the importance of having ‘actionable’ attendance data to guide decision-making about specific, appropriate strategies to address non-attendance. Robust monitoring of attendance data is linked to early identification of risk factors for non-attendance. Early intervention has been found to be six times more effective than dealing with established non-attendance patterns.67 In addition, careful monitoring of attendance data helps the sector and schools to better understand the characteristics of students who are not attending, the underlying causes of non-attendance and how best to intervene.68
4. Tiered, multifaceted school-based strategies
At a school level the research advocates having both prevention and intervention strategies.69 Universal prevention programmes involve building positive social and academic school cultures that foster and sustain attendance. Evidence-based practices include: effective classroom management; setting motivating learning goals; having clear standards and high expectations for attendance; increasing family engagement with the school; promoting positive relationships between teachers and students; promoting connectedness and belonging; implementing an anti-bullying plan; and ensuring cultural safety.
Early intervention and intensive intervention strategies are targeted at groups (mild to moderate non-attendance) and individuals (chronic non-attendance) and the underlying reasons for their non-attendance. Evidence-based practices include: social and emotional skills training; family support, incentives programmes; food-in-school; transport support, mentoring and psycho-social support.
References
- [1] Education and Training Act 2020 (No 38, version as at 01 September 2022), Public Act 36. https://www.legislation.govt.nz/act/public/2020/0038/latest/LMS171382.html
- [1] Education Counts. (2022). Attendance. Ministry of Education. https://www.educationcounts.govt.nz/statistics/attendance
- [1] Webber, A. (2020). He Whakaro: What is the relationship between attendance and attainment? Ministry of Education. https://www.educationcounts.govt.nz/publications/schooling/he-whakaaro-what-is-the-relationship-between-attendance-and-attainment
- [1] Australian Institute for Teaching and School Leadership. (n.d.). Spotlight – Attendance Matters. https://www.aitsl.edu.au/docs/default-source/research-evidence/spotlight/attendance-matters.pdf
- [1] Webber, A. (2020). He Whakaro: School attendance and student wellbeing? Ministry of Education. https://www.educationcounts.govt.nz/publications/schooling/he-whakaaro-school-attendance-and-student-wellbeing
- [1] Webber, A. (2020). He Whakaro: What is the relationship between attendance and attainment? Ministry of Education. https://www.educationcounts.govt.nz/publications/schooling/he-whakaaro-what-is-the-relationship-between-attendance-and-attainment
- [1] Australian Institute for Teaching and School Leadership. (n.d.). Spotlight – Attendance Matters. https://www.aitsl.edu.au/docs/default-source/research-evidence/spotlight/attendance-matters.pdf
- [1] Hanover Research. (2016). Best Practices for Improving Attendance in Secondary Schools. https://browardstudentservices.com/wp-content/uploads/2017/02/Best-Practices-for-Improving-Attendance-in-Secondary-Schools.pdf
- [1] Centre for Education Statistics and Evaluation (2022). Understanding attendance: A review of the drivers of school attendance and best practice approaches. NSW Department of Education. https://education.nsw.gov.au/about-us/educational-data/cese/publications/research-reports/understanding-attendance
- [1] Webber, A. (2020). He Whakaro: What is the relationship between attendance and attainment? Ministry of Education. https://www.educationcounts.govt.nz/publications/schooling/he-whakaaro-what-is-the-relationship-between-attendance-and-attainment
- [1] Webber, A. (2020). He Whakaro: What is the relationship between attendance and attainment? Ministry of Education. https://www.educationcounts.govt.nz/publications/schooling/he-whakaaro-what-is-the-relationship-between-attendance-and-attainment
- [1] Australian Institute for Teaching and School Leadership. (n.d.). Spotlight – Attendance Matters. https://www.aitsl.edu.au/docs/default-source/research-evidence/spotlight/attendance-matters.pdf
- [1] Australian Institute for Teaching and School Leadership. (n.d.). Spotlight – Attendance Matters. https://www.aitsl.edu.au/docs/default-source/research-evidence/spotlight/attendance-matters.pdf
- [1] Webber, A. (2020). He Whakaro: School attendance and student wellbeing? Ministry of Education. https://www.educationcounts.govt.nz/publications/schooling/he-whakaaro-school-attendance-and-student-wellbeing
- [1] Webber, A. (2020). He Whakaro: School attendance and student wellbeing? Ministry of Education. https://www.educationcounts.govt.nz/publications/schooling/he-whakaaro-school-attendance-and-student-wellbeing
- [1] Scott, D. (2020). Education and earnings, a New Zealand update. Ministry of Education. https://www.educationcounts.govt.nz/publications/80898/education-and-earnings
- [1] Centre for Education Statistics and Evaluation (2022). Understanding attendance: A review of the drivers of school attendance and best practice approaches. NSW Department of Education. https://education.nsw.gov.au/about-us/educational-data/cese/publications/research-reports/understanding-attendance
- [1] Centre for Education Statistics and Evaluation (2022). Understanding attendance: A review of the drivers of school attendance and best practice approaches. NSW Department of Education. https://education.nsw.gov.au/about-us/educational-data/cese/publications/research-reports/understanding-attendance
- [1] Australian Institute for Teaching and School Leadership. (n.d.). Spotlight – Attendance Matters. https://www.aitsl.edu.au/docs/default-source/research-evidence/spotlight/attendance-matters.pdf
- [1] McCauley, L., & Chappell, N. (2018). Using behavioural insights to reduce unjustified school absences. Ministry of Education. https://www.educationcounts.govt.nz/publications/schooling/using-behavioural-insights-to-reduce-unjustified-school-absences
- [1] Australian Institute for Teaching and School Leadership. (n.d.). Spotlight – Attendance Matters. https://www.aitsl.edu.au/docs/default-source/research-evidence/spotlight/attendance-matters.pdf
- [1] Australian Institute for Teaching and School Leadership. (n.d.). Spotlight – Attendance Matters. https://www.aitsl.edu.au/docs/default-source/research-evidence/spotlight/attendance-matters.pdf
- [1] Centre for Education Statistics and Evaluation (2022). Understanding attendance: A review of the drivers of school attendance and best practice approaches. NSW Department of Education. https://education.nsw.gov.au/about-us/educational-data/cese/publications/research-reports/understanding-attendance
- [1] Ministry of Education. (2021). Inquiry into school attendance: Initial briefing https://www.parliament.nz/resource/en-NZ/53SCEW_ADV_112081_EW4498/2f4c3b45bd6878fe840d5e497a5ef0a89262fe3e
- [1] Education Counts. (2022). Attendance. Ministry of Education. https://www.educationcounts.govt.nz/statistics/attendance
- [1] Education Review Office. (2021). Learning in a Covid-19 World: The Impact of Covid-19 on Schools. https://ero.govt.nz/our-research/learning-in-a-covid-19-world-the-impact-of-covid-19-on-schools
- [1] Hanover Research. (2016). Best Practices for Improving Attendance in Secondary Schools. https://browardstudentservices.com/wp-content/uploads/2017/02/Best-Practices-for-Improving-Attendance-in-Secondary-Schools.pdf
- [1] Centre for Education Statistics and Evaluation (2022). Understanding attendance: A review of the drivers of school attendance and best practice approaches. NSW Department of Education. https://education.nsw.gov.au/about-us/educational-data/cese/publications/research-reports/understanding-attendance
- [1] Australian Institute for Teaching and School Leadership. (n.d.). Spotlight – Attendance Matters. https://www.aitsl.edu.au/docs/default-source/research-evidence/spotlight/attendance-matters.pdf
- [1] Centre for Education Statistics and Evaluation (2020). Supporting students’ sense of belonging: Every student is known, valued and cared for in our schools. NSW Department of Education. https://education.nsw.gov.au/content/dam/main-education/about-us/educational-data/cese/2020-supporting-students-sense-of-belonging.pdf
- [1] Denny, S., Galbreath, R.A., Grant, S. & Milfont, T.L. (2010). Youth’07: The health and wellbeing of secondary school students in Aotearoa New Zealand. Students who truant: What makes a difference? Auckland. The University of Auckland. https://www.fmhs.auckland.ac.nz/assets/fmhs/faculty/ahrg/docs/2007-truancy-report.pdf
- [1] Biddulph, F., Biddulph, J., & Biddulph, C. (2033). The Complexity of Community and Family Influences on Children's Achievement in New Zealand: Best Evidence Synthesis Iteration (BES). Ministry of Education. https://www.educationcounts.govt.nz/publications/series/2515/5947
- [1] Stats NZ (2022). Increase in cost of living reaches new high. https://www.stats.govt.nz/news/increase-in-cost-of-living-reaches-new-high
- [1] Perry, B. (2022). MSD Child Poverty Report 2022: Overview and Selected Findings. Ministry of Social Development. https://www.msd.govt.nz/documents/about-msd-and-our-work/publications-resources/research/child-poverty-in-nz/2022-child-poverty-report-overview-and-selected-findings.pdf
- [1] Perry, B. (2022). MSD Child Poverty Report 2022: Overview and Selected Findings. Ministry of Social Development. https://www.msd.govt.nz/documents/about-msd-and-our-work/publications-resources/research/child-poverty-in-nz/2022-child-poverty-report-overview-and-selected-findings.pdf
- [1] Perry, B. (2022). MSD Child Poverty Report 2022: Overview and Selected Findings. Ministry of Social Development. https://www.msd.govt.nz/documents/about-msd-and-our-work/publications-resources/research/child-poverty-in-nz/2022-child-poverty-report-overview-and-selected-findings.pdf
- [1] Perry, B. (2022). MSD Child Poverty Report 2022: Overview and Selected Findings. Ministry of Social Development. https://www.msd.govt.nz/documents/about-msd-and-our-work/publications-resources/research/child-poverty-in-nz/2022-child-poverty-report-overview-and-selected-findings.pdf
- [1] Denny, S., Galbreath, R.A., Grant, S. & Milfont, T.L. (2010). Youth’07: The health and wellbeing of secondary school students in Aotearoa New Zealand. Students who truant: What makes a difference? Auckland. The University of Auckland. https://www.fmhs.auckland.ac.nz/assets/fmhs/faculty/ahrg/docs/2007-truancy-report.pdf
- [1] Hanover Research. (2016). Best Practices for Improving Attendance in Secondary Schools. https://browardstudentservices.com/wp-content/uploads/2017/02/Best-Practices-for-Improving-Attendance-in-Secondary-Schools.pdf
- [1] Centre for education Statistics and Evaluation (2022). Understanding attendance: A review of the drivers of school attendance and best practice approaches. NSW Department of Education. https://education.nsw.gov.au/about-us/educational-data/cese/publications/research-reports/understanding-attendance
- [1] Kōrero Mātauranga. (n.d.). Ka Hikitia and Tau Mai Te Reo (Māori Education): Continuing our kōrero about the future of Māori education. Ministry of Education. https://conversation.education.govt.nz/conversations/maori-education/
- [1] Bishop, R., Berryman, M., Tiakiwai, S., & Richardson, C. (2003). Te Kotahitanga Phase 1: The experiences of Year 9 and 10 Māori students in mainstream classrooms. Ministry of Education. https://www.educationcounts.govt.nz/__data/assets/pdf_file/0017/7532/te-kotahitanga.pdf
- [1] Milne, B. A. (2013). Colouring in the white spaces: Reclaiming cultural identity in whitestream schools (Thesis, Doctor of Philosophy (PhD)). University of Waikato, Hamilton, New Zealand. https://hdl.handle.net/10289/7868
- [1] Waitangi Tribunal. (1986). Report of The Waitangi Tribunal on The Te Reo Māori Claim. https://forms.justice.govt.nz/search/Documents/WT/wt_DOC_68482156/Report%20on%20the%20Te%20Reo%20Maori%20Claim%20W.pdf
- [1] Children’s Commissioner. (2018). He manu kai matauranga: He tirohanga Māori: Experiences of tamariki and rangatahi Māori. https://www.occ.org.nz/publications/reports/education-matters-to-me-experiences-of-tamariki-and-rangatahi-maori/
- [1] Tokona te Raki: Māori Futures Collective. (2021). Ending Streaming in Aotearoa. http://www.maorifutures.co.nz/wp-content/uploads/2021/03/TTR_Streaming_document.pdf
- [1] Alansari, M., Hunia, M., & Eyre, J. (2020). A rapid review of racism in schools: Working paper. NZCER. https://www.nzcer.org.nz/system/files/Racism%20in%20schools-Rapid%20review%20working%20paper-FINAL.pdf
- [1] Education Review Office. (2019). Bullying Prevention and Response in New Zealand Schools. https://ero.govt.nz/our-research/bullying-prevention-and-response-in-new-zealand-schools-may-2019
- [1] Ministry of Education. (2017). New Zealand Students’ Wellbeing Report. https://www.educationcounts.govt.nz/__data/assets/pdf_file/0005/181544/PISA-2015-NZ-Students-Wellbeing-Report.pdf
- [1] Caygill, R., Hanlar, V., & Harris-Mille, C. (2016). New Zealand’s school climate for learning: what we know from TIMSS 2014/15. Ministry of Education. https://www.educationcounts.govt.nz/publications/schooling/2571/timss-201415/new-zealands-school-climate-for-learning-what-we-know-from-timss-201415
- [1] Stats NZ. (2022). Unemployment rate at 3.3 percent. https://www.stats.govt.nz/news/unemployment-rate-at-3-3-percent
- [1] Stats NZ. (2022). Labour market statistics: June 2022 quarter. https://www.stats.govt.nz/information-releases/labour-market-statistics-june-2022-quarter/
- [1] Scott, D. (2020). Education and earnings: A New Zealand update. https://www.educationcounts.govt.nz/__data/assets/pdf_file/0006/198987/Education-and-Earnings-a-New-Zealand-update.pdf
- [1] Ministry of Education. (2022). School Attendance- Baseline Survey. https://assets.education.govt.nz/public/Documents/Te-Mahau/Baseline-Research_V2.pdf
- [1] Ministry of Education. (2021). Ka Hikitia – Ka Hāpaitia. https://www.education.govt.nz/our-work/overall-strategies-and-policies/ka-hikitia-ka-hapaitia/
- [1] Ministry of Education. (2021). Action Plan for Pacific Education 2020–2030. https://www.education.govt.nz/our-work/overall-strategies-and-policies/action-plan-for-pacific-education-2020-2030/
- [1]Ministry of Education. (2022). The Statement of National Education and Learning Priorities (NELP) and the Tertiary Education Strategy (TES). https://www.education.govt.nz/our-work/overall-strategies-and-policies/the-statement-of-national-education-and-learning-priorities-nelp-and-the-tertiary-education-strategy-tes/
- [1] Centre for Education Statistics and Evaluation (2022). Understanding attendance: A review of the drivers of school attendance and best practice approaches. NSW Department of Education. https://education.nsw.gov.au/about-us/educational-data/cese/publications/research-reports/understanding-attendance
- [1] Centre for Education Statistics and Evaluation (2022). Understanding attendance: A review of the drivers of school attendance and best practice approaches. NSW Department of Education. https://education.nsw.gov.au/about-us/educational-data/cese/publications/research-reports/understanding-attendance
- [1] Hanover Research. (2016). Best Practices for Improving Attendance in Secondary Schools. https://browardstudentservices.com/wp-content/uploads/2017/02/Best-Practices-for-Improving-Attendance-in-Secondary-Schools.pdf
- [1] Hanover Research. (2016). Best Practices for Improving Attendance in Secondary Schools. https://browardstudentservices.com/wp-content/uploads/2017/02/Best-Practices-for-Improving-Attendance-in-Secondary-Schools.pdf
- [1] Centre for Education Statistics and Evaluation (2022). Understanding attendance: A review of the drivers of school attendance and best practice approaches. NSW Department of Education. https://education.nsw.gov.au/about-us/educational-data/cese/publications/research-reports/understanding-attendance
- [1] Centre for Education Statistics and Evaluation (2022). Understanding attendance: A review of the drivers of school attendance and best practice approaches. NSW Department of Education. https://education.nsw.gov.au/about-us/educational-data/cese/publications/research-reports/understanding-attendance
- [1] Centre for Education Statistics and Evaluation (2022). Understanding attendance: A review of the drivers of school attendance and best practice approaches. NSW Department of Education. https://education.nsw.gov.au/about-us/educational-data/cese/publications/research-reports/understanding-attendance