Summary
This report presents our findings from a student survey about how well their schools prevent and respond to bullying.
This report accompanies another one on how well schools are working towards a bullying-free environment.
Read the report on Bullying Prevention and Response in New Zealand Schools
We talked to thousands of students
In Terms 1 and 2 in 2018, we surveyed over 11,000 students in Year 4 to Year 13 through an optional online survey.
The survey asked students questions under three topics.
- Their awareness of bullying
- Their confidence to apply strategies taught in their school to prevent bullying
- What happened when they responded to a bullying incident
Some students were bullied more than others
We discovered the following:
- One‑third of students said they had been bullied at their school.
- Over half of gender-diverse students said they had been bullied at their school.
- Māori and Pākehā students reported more bullying than other ethnicities.
Most students knew what to do when bullied
Our five key findings on how students experienced and responded to bullying are below.
- Most students who were bullied said it happened weekly or daily.
- Most students have been taught by their school what to do if they experience or witness bullying.
- Many students would tell an adult if they were bullied.
- Many students applied what they’d learned when they experienced or witnessed bullying.
- The bullying completely stopped for only some of the students who applied what they had learned.
Schools can support students more
We recommend that school leaders and teachers take appropriate action when bullying occurs and monitor the situation over time, particularly for at-risk groups. Schools also need to work more proactively with parents and whānau because students are more likely to report bullying to their whānau.
Whole article:
Bullying Prevention and Response: Student VoiceIntroduction
This report focuses on Years 4 to 13 students’ experience of bullying prevention and response in schools. The information was collected via a voluntary online survey in 136 New Zealand schools during Terms 1 and 2, 2018. The survey questions focused on students’ awareness of bullying, confidence and application of bullying prevention strategies taught in their school, and what happened when they responded to a bullying incident. In publishing this report, ERO intends to explore in depth, and elevate the voices of students on an issue that affects them profoundly. Improved student agency is a powerful potential lever for moving towards a bullying-free environment in all New Zealand schools.
The evaluative question this report will answer is:
How well are schools’ efforts in bullying prevention and response working for students?
To answer the evaluative question, the report is structured on the following five sub-questions:
- How aware are students that they are being bullied, and what impact could bullying have on students?
- Have students been taught by their school what to do when they experience or witness bullying?
- Do students tell an adult if they experience bullying?
- Do students apply what they have learned when experiencing/witnessing bullying, and if not, why not?
- If students do apply what they had learned when experiencing/witnessing bullying, does the bullying stop?
ERO is simultaneously releasing two reports in 2019 on bullying prevention and response. The companion to this report, Bullying Prevention and Response in New Zealand Schools, focuses on the extent to which schools are working towards a bullying-free environment, and is based on data ERO’s review officers collected while onsite during schools’ regular education reviews in Terms 1 and 2, 2018. The report draws on interviews and meetings with school leaders, trustees, teachers and students, as well as observations and document analysis.
Key findings
Most students who had been bullied experienced negative behaviours weekly or daily
Thirty-nine percent of students said they had been bullied at their current school. Students most commonly reported experiencing non-physical forms of negative behaviour, such as being left out or called names. Gender-diverse, male and primary-aged students were more likely to experience negative behaviours compared to female and secondary-aged students.
Of the 61 percent of students who said they had not been bullied, many nevertheless still reported experiencing negative behaviours once or twice a month. Students who experienced multiple negative behaviours were less likely to feel people accepted them in their school or to say that they enjoyed being at school.
Most students have been taught by their school what to do if they experienced or witnessed bullying
Eighty-three percent of students had learned at school what to do when they experienced or witnessed bullying. Eighty-nine percent of primary-aged students had learned what to do when experiencing bullying, compared to 76 percent of secondary-aged students.
Many students would tell an adult if they experienced bullying
Parents were the people students were most likely speak to if they experienced bullying. Students who had learned at school what to do when experiencing bullying were more likely to speak to someone if they then experienced bullying. Sixty percent of students would tell an adult at their school if they were experiencing bullying. Secondary-aged students were less likely than primary-aged students to tell an adult in their school, such as their teacher.
Many students applied what they had learned when they experienced or witnessed bullying
Students who had learned what to do when witnessing or experiencing bullying were more likely than those who had not learned what to do, to say that they were confident to use bullying response strategies. Furthermore, students who were confident were also more likely to apply what they had learned when they experienced or witnessed bullying.
Of the students who experienced or witnessed bullying, the majority applied what they had learned at their current school in response. For most students who did not apply what they had learned this was because of a lack of confidence, or not knowing how to apply what they had learned in the particular context.
Only some students who applied what they had learned had the bullying completely stop
Of the students who applied what they had learned, only 36 percent reported that the bullying had stopped. The remaining students had the bullying stop for a while but then start again, or not stop at all. For a few students, after applying the strategies they had learned, the bullying got worse.
How ERO distributed this survey
ERO distributed the survey to primary and secondary schools that were part of ERO’s regular education review cycle during Term 1, and to secondary schools in Term 2, 2018. Schools distributed the survey link to students in Years 4 to 13, and students could access the survey in either Te Reo Māori or English on SurveyMonkey. Students responded to the survey individually.
Students were asked their school’s name and location, their current school year, gender and ethnicity, and how long they had been going to their school. None of these questions were compulsory.
Student responses were analysed based on student year groups, which were collapsed into two age brackets:
- primary-aged students: students in Years 4 to 8
- secondary-aged students: students in Years 9 to 13.
In relation to bullying prevention and response, the survey asked students:
- who they would speak to if they experienced bullying
- their sense of belonging to school
- what form(s) of bullying behaviours they had experienced
- if they had been bullied, or seen bullying, at their current school
- how confident they felt to respond to bullying, either of themselves or others.
The complete list of questions asked in the survey can be found in Appendix 2.
ERO received responses from over 11,000 students
The responses from 11,085 New Zealand students across 66 schools were used for analysis. Not all respondents completed every question. A breakdown of the characteristics of the schools that had students contribute to the survey is in Appendix 3.
A full breakdown of the characteristics of respondents can be found in Appendix 4.
The characteristics of respondents in the sample are not representative of the national population of students as per Ministry of Education roll data from July 2018. Specifically, female students were over-represented in the sample, and Māori students were under-represented. Therefore, the findings of this report should not necessarily be generalised to the New Zealand population of students. However, the responses in this report have been weighted for gender, school-age, and ethnicity to bring proportions more in line with national percentages. A full breakdown of the unweighted survey responses is in Appendix 5.
ERO received 11,161 responses to the survey. Responses were cleaned to make sure respondents were based in New Zealand. Seventy-four responses were removed from the sample as they were completed outside of New Zealand. This was checked against an IP address locator, and the school name provided was checked to see if it matched the IP address. No school could be clearly identified in 137 of the responses. These responses were still included in the sample.
Findings
One-third of students had been bullied at their school
Students were asked if they had been bullied in their school, and if they had seen anyone else being bullied in their school. ERO found differences according to age group, gender and ethnicity. The difference between groups in this report was tested using a Chi square test. The significance level for all statistical testing in this report was p < 0.05. The impact of ethnicity, gender, and school-age, were tested against different questions using a regression model.
Primary-aged students experienced and witnessed bullying more than secondary-aged students
Forty-six percent of primary-aged students had been bullied, compared to 31 percent of secondary-aged students.
Rates of witnessing someone else being bullied were similar between primary and secondary-aged students. Sixty-one percent of primary-aged students said they had seen someone bullied at their school, compared to 58 percent of secondary-aged students.
Over half of gender-diverse students said they had been bullied at their school
Fifty-eight percent of students who identified as gender-diverse said they had been bullied at their school. Forty-two percent of males said they had been bullied, compared to 37 percent of females.
Māori and Pākehā students experienced bullying more than other ethnicities
Forty-two percent of Māori students experienced bullying, compared to 40 percent of Pākehā students, and 36 percent of Pacific students. Thirty-two percent of Asian students said they had been bullied. However, a higher proportion of Asian students were from secondary schools, a grouping that had fewer students state they had experienced bullying.
We investigated how much the ethnicity of students contributed to whether they experienced negative behaviours and who they would speak to. Once findings have been corrected for age, ethnicity and gender, we found that differences in being bullied were more strongly associated with gender (particularly gender-diverse) and age than with ethnicity. In other words being a Māori male primary student meant you were slightly more likely to be bullied than if you were a Pacific or Asian male primary student. However, if you were a Pākehā male primary student the likelihood of being bullied was similar to Māori males in primary schools.
Negative behaviour experienced at school
Students were asked if they experienced any of the eight negative behaviours listed below. If students had experienced these behaviours, they were asked if they occurred on a monthly, weekly or daily basis.
Students were asked if they had:
- been called names, put down, or teased in a mean way
- been left out by other students or ignored on purpose
- lies or bad stories spread about them
- been made to do something they didn’t want to do
- been physically assaulted (such as hit, pushed, kicked, punched, choked)
- personal things (like pens, clothes or money) damaged in a mean way, or stolen
- been threatened
- received nasty messages on their phone or computer (like text or Facebook messages)
- experienced other negative behaviour (students were asked to describe what these behaviours were. These were too varied to include in the figures that follow).
The most common negative behaviours experienced were non-physical
The most common negative behaviour students reported they experienced, at least monthly, was being called names, put down or teased (see Figure 1). Thirty-nine percent of students experienced this behaviour at least monthly.
Almost one quarter of students said they had been hit, pushed, kicked, punched and/or choked at least monthly.
Figure 1: The most common negative behaviour that students experienced at least monthly was being called names, put down, or teased
Figure 1 is a graph showing the proportion of students who experienced different types of negative behaviours at their school. For each of these behaviours, students also indicated how often they experienced them. One to two times a month, one to two times a week, and one to two times a day. These are provided for each negative behaviour. Behaviour one, called names, put down or teased. Twenty percent of students experienced this monthly. Eleven percent experienced this weekly. Eight percent experienced this daily. Behaviour two, left out or ignored by other students. Twenty-two percent of students experienced this monthly. Nine percent experienced this weekly. Five percent experienced this daily. Behaviour three, lies or bad stories spread [about them]. Twenty percent of students experienced this monthly. Six percent experienced this weekly. Four percent experienced this daily. Behaviour four, made to do something they didn’t want to do. Fifteen percent of students experienced this monthly. Four percent experienced this weekly. Three percent experienced this daily. Behaviour five, hit, pushed, kicked, punched, choked. Fourteen percent of students experienced this monthly. Four percent experienced this weekly. Four percent experienced this daily. Behaviour six, personal things damaged or stolen. Sixteen percent of students experienced this monthly. Four percent experienced this weekly. Three percent experienced this daily. Behaviour seven, been threatened. Eleven percent of students experienced this monthly. Four percent experienced this weekly. Three percent experienced this daily. Behaviour eight, nasty messages sent to their phone or computer. Seven percent of students experienced this monthly. Two percent experienced this weekly. Two percent experienced this daily.
Primary-aged students were more likely to experience most of the negative behaviours
A higher percentage of primary-aged students experienced most of the negative behaviours, compared to secondary-aged students (see Figure 2). The only negative behaviour secondary-aged students experienced more was receiving nasty messages on their phone or computer.
Figure 2: Primary-aged students were more likely to experience most of the negative behaviours in their school
Figure 2 is a graph showing the proportion of students who experienced different types of negative behaviours during the past month, dependant on their school age. Behaviour one, called names, put down or teased. Forty-one percent of primary-aged students experienced this in the past month. Thirty-seven percent of secondary-aged students experienced this in the past month. Behaviour two, left out or ignored by other students. Forty percent of primary-aged students experienced this in the past month. Thirty-four percent of secondary-aged students experienced this in the past month. Behaviour three, lies or bad stories spread [about them]. Thirty percent of primary-aged students experienced this in the past month. Thirty percent of secondary-aged students experienced this in the past month. Behaviour four, made to do something they didn’t want to do. Twenty-seven percent of primary-aged students experienced this in the past month. Eighteen percent of secondary-aged students experienced this in the past month. Behaviour five, hit, pushed, kicked, punched, choked. Twenty-nine percent of primary-aged students experienced this in the past month. Sixteen percent of secondary-aged students experienced this in the past month. Behaviour six, personal things damaged or stolen. Twenty-four percent of primary-aged students experienced this in the past month. Twenty percent of secondary-aged students experienced this in the past month. Behaviour seven, been threatened. Twenty percent of primary-aged students experienced this in the past month. Seventeen percent of secondary-aged students experienced this in the past month. Behaviour eight, nasty messages sent to their phone or computer. Nine percent of primary-aged students experienced this in the past month. Fourteen percent of secondary-aged students experienced this in the past month.
Male and gender-diverse students experienced more negative behaviours than female students
Gender-diverse students were more likely than both male and female students to experience all of the negative behaviours listed in the survey (see Figure 3). Male students were more likely than female students to experience the most negative behaviours. Female students were more likely to experience being left out or ignored by other students and having lies or bad stories spread about them.
Figure 3: A higher percentage of gender-diverse students experienced negative behaviours, compared to males and females
Figure 3 is a graph showing the proportion of students who experienced different types of negative behaviours during the past month, dependant on their gender. Behaviour one, called names, put down or teased. Fifty-seven percent of gender-diverse students experienced this in the past month. Forty-four percent of male students experienced this in the past month. Thirty-four percent of female students experienced this in the past month. Behaviour two, left out or ignored by other students. Fifty-five percent of gender-diverse students experienced this in the past month. Thirty-five percent of male students experienced this in the past month. forty percent of female students experienced this in the past month. Behaviour three, lies or bad stories spread [about them]. Forty-nine percent of gender-diverse students experienced this in the past month. Twenty-eight percent of male students experienced this in the past month. Thirty-one percent of female students experienced this in the past month. Behaviour four, made to do something they didn’t want to do. Thirty-six percent of gender-diverse students experienced this in the past month. Twenty-five percent of male students experienced this in the past month. Twenty-one percent of female students experienced this in the past month. Behaviour five, hit, pushed, kicked, punched, choked. Thirty-five percent of gender-diverse students experienced this in the past month. Thirty-one percent of male students experienced this in the past month. Fifteen percent of female students experienced this in the past month. Behaviour six, personal things damaged or stolen. Thirty-eight percent of gender-diverse students experienced this in the past month. Twenty-six percent of male students experienced this monthly. Nineteen percent of female students experienced this monthly. Behaviour seven, been threatened. Forty-four percent of gender-diverse students experienced this monthly. Twenty-four percent of male students experienced this monthly. Thirteen percent of female students experienced this monthly. Behaviour eight, nasty messages sent to their phone or computer. Thirty-two percent of gender-diverse students experienced this monthly. Eleven percent of male students experienced this monthly. Eleven percent of female students experienced this monthly.
Students who experienced negative behaviours did not necessarily consider they were being bullied
ERO compared the data about students’ experiences of these negative behaviours with their experiences of bullying at their school (see Figure 4). At least one-quarter of students who said they had not been bullied had actually experienced at least one negative behaviour in the past month. In addition, a few students who said they had not been bullied, had experienced negative behaviours, such as being threatened or assaulted.
Figure 4: Some students that said they had not experienced bullying had still experienced negative behaviours at least monthly
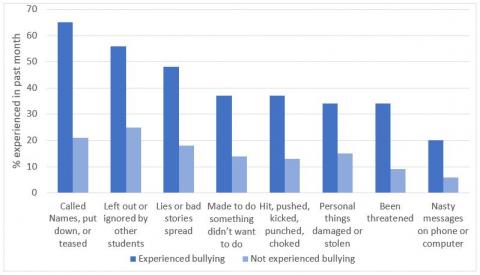
Figure 4 is a graph showing the proportion of students who experienced different types of negative behaviours during the past month, dependant on their response to a separate question asking if they had been bullied at their school. Behaviour one, called names, put down or teased. Sixty-five percent of students who said they had been bullied experienced this in the past month. Twenty percent of students who said they had not been bullied experienced this in the past month. Behaviour two, left out or ignored by other students. Fifty-eight percent of students who said they had been bullied experienced this last month. Twenty-six percent of students who said they had not been bullied experienced this in the past month. Behaviour three, lies or bad stories spread [about them]. Forty-nine percent of students who said they had been bullied experienced this last month. Seventeen percent of students who said they had not been bullied experienced this in the past month. Behaviour four, made to do something they didn’t want to do. Thirty-seven percent of students who said they had been bullied experienced this last month. Thirteen percent of students who said they had not been bullied experienced this in the past month. Behaviour five, hit, pushed, kicked, punched, choked. Thirty-six percent of students who said they had been bullied experienced this last month. Eleven percent of students who said they had not been bullied experienced this in the past month. Behaviour six, personal things damaged or stolen. Thirty-three percent of students who said they had been bullied experienced this last month. Thirteen percent of students who said they had not been bullied experienced this in the past month. Behaviour seven, been threatened. Thirty-three percent of students who said they had been bullied experienced this last month. Eight percent of students who said they had not been bullied experienced this in the past month. Behaviour eight, nasty messages sent to their phone or computer. Twenty-two percent of students who said they had been bullied experienced this last month. Six percent of students who said they had not been bullied experienced this in the past month.
Students may recognise bullying to have an element of repetition
For most of the students who said they had not been bullied, but had experienced negative behaviours, these behaviours happened once or twice a month (see Figure 5). The reason for this could be that students consider that bullying occurs more frequently.
Figure 5: The majority of students who said they have not been bullied, but experienced negative behaviours, tended to experience these events less frequently.
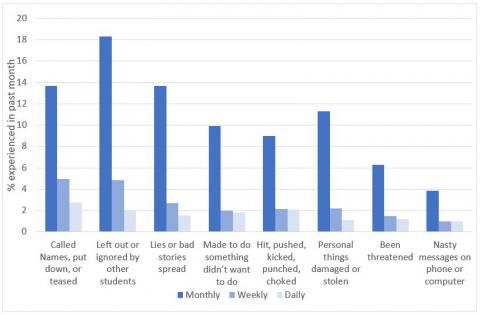
Figure 5 is a graph showing the proportion of students who said they had not been bullied, but had experienced negative behaviours during the past month. For each of these behaviours, students are grouped by how often they experienced these behaviours. Behaviour one, called names, put down or teased. Fourteen percent experienced this monthly. Five percent experienced this weekly. Three percent experienced this daily. Behaviour two, left out or ignored by other students. Eighteen percent experienced this monthly. Five percent experienced this weekly. Two percent experienced this daily. Behaviour three, lies or bad stories spread [about them]. Fourteen percent experienced this monthly. Three percent experienced this weekly. Two percent experienced this daily. Behaviour four, made to do something they didn’t want to do. Ten percent experienced this monthly. Two percent experienced this weekly. Two percent experienced this daily. Behaviour five, hit, pushed, kicked, punched, choked. Nine percent experienced this monthly. Two percent experienced this weekly. Two percent experienced this daily. Behaviour six, personal things damaged or stolen. Eleven percent experienced this monthly. Two percent experienced this weekly. One percent experienced this daily. Behaviour seven, been threatened. Six percent experienced this monthly. One percent experienced this weekly. One percent experienced this daily. Behaviour eight, nasty messages sent to their phone or computer. Four percent experienced this monthly. One percent experienced this weekly. One percent experienced this daily.
Students who experienced more negative behaviours felt less belonging to their school
ERO asked four questions to assess students’ sense of belonging at school. The questions asked students if they:
- felt people accepted them for who they are
- enjoyed being at school
- learned how they should treat each other
- felt teachers behaved how they would like the students to behave.
Of the students who experienced no negative behaviours, 85 percent were likely to say they felt accepted at school and enjoyed being at school. In contrast, of those students who experienced all eight negative behaviours only one-third felt accepted at school (34 percent) and enjoyed school (42 percent).
Figure 6: Students who experienced more negative behaviours were less likely to enjoy being, or feel accepted, at school
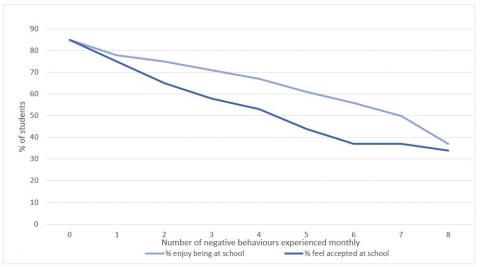
Figure 6 is a graph showing the percentage of students that enjoy being at school, and the percentage of students that feel accepted at school. This has been graphed dependant on how many negative behaviours students experienced. For those students that did not experience any negative behaviours in the past month, eighty-five percent said they enjoyed being at school. Eighty-five percent said they felt accepted at school. For those students that experienced one negative behaviour in the past month, seventy-eight percent said they enjoyed being at school. Seventy-five percent said they felt accepted at school. For those students that experienced two negative behaviours in the past month, seventy-five percent said they enjoyed being at school. Sixty-five percent said they felt accepted at school. For those students that experienced three negative behaviours in the past month, Seventy-one percent said they enjoyed being at school. Fifty-eight percent said they felt accepted at school. For those students that experienced Four negative behaviours in the past month, sixty-seven percent said they enjoyed being at school. Fifty-three percent said they felt accepted at school. For those students that experienced five negative behaviours in the past month, sixty-one percent said they enjoyed being at school. Forty-four percent said they felt accepted at school. For those students that experienced six negative behaviours in the past month, fifty-six percent said they enjoyed being at school. Thirty-seven percent said they felt accepted at school. For those students that experienced seven negative behaviours in the past month, fifty percent said they enjoyed being at school. Thirty-seven percent said they felt accepted at school. For those students that experienced all eight negative behaviours in the past month, thirty-seven percent said they enjoyed being at school. Thirty-four percent said they felt accepted at school.
Most students have been taught by their school what to do when they experience or witness bullying
Students were asked if, at their current school, they had learned what to do if they are bullied by other students, or if they see other students being bullied. Eighty-three percent of students said they had learned what to do at school if they experienced, or witnessed bullying.
More primary-aged students had learned what to do compared to secondary-aged students
Eighty-nine percent of primary-aged students reported that they had learned what to do when experiencing bullying, compared to 75 percent of secondary-aged students. However, only 31 percent of secondary-aged students experienced bullying in their school, compared to 46 percent of primary-aged students.
The differences between students who had, and had not, learned what to do at school, will be explored in the following sections.
Do students tell an adult if they experience bullying?
Students were asked who they would tell if they had been bullied. They could select as many options as they wanted from the list below:
- parent or caregiver
- friends
- teacher
- other adults at school – for example, principal, dean or counsellor
- nobody
- another person.
Additional responses included: siblings, cousins, grandparents, partners, senior students, God.
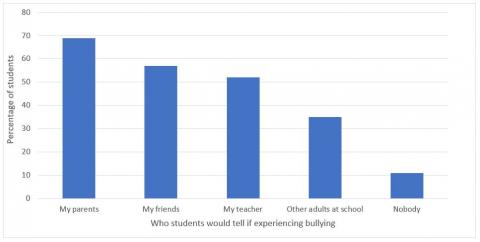
Students were more likely to tell their parents if they had been bullied
The most common person students would tell if they were being bullied was a parent (69 percent), followed by a friend (57 percent). Of concern was that 11 percent of students said they would not tell anybody.
Figure 7: Students were most likely to tell their parents or friends when they had experienced bullying
Most students of different ethnicities would tell somebody if they experienced bullying
Pacific students were the least likely to report bullying. The percentage of students who would tell their parents varied across ethnic groups. Pākehā students were most likely to talk to their parents (73 percent). In comparison, 66 percent of Māori and Asian, and 65 percent of Pacific, students would tell their parents.
Students who learned what to do were more likely to tell somebody
Students who had learned what to do when experiencing bullying were more likely to tell their parents than those who had not learned what to do (75 percent compared to 54 percent). Students who learned what to do were also more likely to tell an adult in their school. Fifty-eight percent of students who had learned what to do would tell their teacher, compared to only 34 percent of students who did not learn what to do. Telling friends was something that many students would do regardless if they had learned what to do or not (60 percent compared with 54 percent). Nine percent of students who had learned what to do chose not to tell anybody. By contrast, 22 percent of those who had not learned what to do did not report bullying.
Figure 8: Students who learned what to do when experiencing bullying were more likely to tell someone
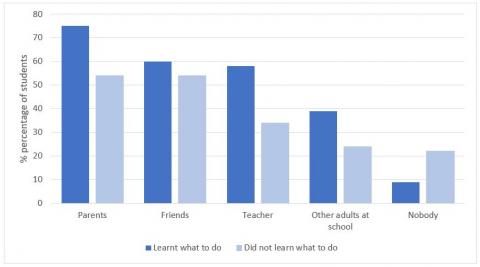
Figure 8 is a graph showing who students would tell if they experienced bullying, spilt by those that said they had learnt what to do if they were bullied and those that had not. Seventy-five percent of students who had learnt what to do said they would tell their parents. Fifty-four percent of students who had not learnt what to do said they would tell their parents. Sixty percent of students who had learnt what to do said they would tell their friends. Fifty-four percent of students who had not learnt what to do said they would tell their friends. Fifty-eight percent of students who had learnt what to do said they would tell their teacher. Thirty-four percent of students who had not learnt what to do said they would tell their teacher. Thirty-nine percent of students who had learnt what to do said they would tell other adults at their school. Twenty-four percent of students who had not learnt what to do said they would tell other adults at their school. Nine percent of students who had learnt what to do said they would not tell anyone. Twenty-two percent of students who had not learnt what to do said they would not tell anyone.
Secondary-aged students were more likely to tell a friend
Secondary-aged students were slightly more likely than primary-aged students to tell their friends if they experienced bullying (62 percent compared to 53 percent). However, 17 percent of secondary-aged students would not tell anybody, compared to only six percent of primary-aged students.
Gender-diverse students were more likely not to tell anybody
Twenty-three percent of gender-diverse students said they would not tell anybody if they were experiencing bullying. This is double the percentage of male and female students who said they would tell nobody (12 percent and 9 percent respectively). Males were slightly more likely than females to tell their teacher (55 percent compared to 51 percent); and females were more likely than males to tell their friends (64 percent compared to 51 percent).
The percentages for gender-diverse students are unweighted, as population figures were not available.
Do students apply what they had learned when experiencing/witnessing bullying, and if not, why not?
Students were asked how confident they felt to use the knowledge they had learned about what to do if they experienced bullying. Only students who had been bullied, or seen someone being bullied, were asked these questions, which accounted for 58 percent of the sample (n = 6416).
Students who had learned what to do at school were more confident to act
Of the 83 percent of students who had learned at school what to do if they experienced bullying, most (85 percent) were a little confident or very confident to apply their knowledge when they, or another student, was being bullied.
Of the 17 percent of students who had not learned at school what to do when experiencing bullying, only 69 percent were a little confident or very confident to deal with bullying. These relationships are presented graphically in Figure 9 below. In Figure 9, ‘Confident’ is a combination of two options in the survey: ‘a little confident’, and ‘very confident’.
Figure 9: Students who had learned what to do when experiencing bullying were more confident to apply their learning
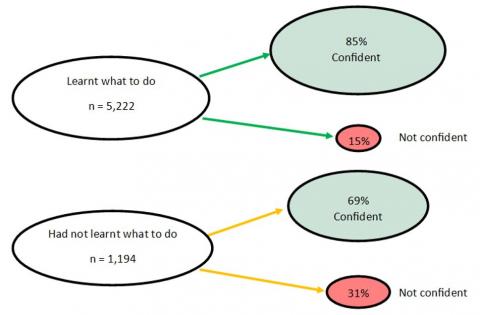
Figure 9 is a diagram showing two groups of students; those who, at their current school, had learnt what to do when faced with bullying. And those that had not. These two groups are then split dependant on how confident students felt to apply what they had learnt. Eighty-five percent of those students who had learnt what to do at their current school were confident to apply their learning. Fifteen percent were not confident. Sixty-nine percent of students who had not learnt what to do at their current school were confident to apply their learning. Thirty-one percent were not confident.
More primary-aged students were confident to say or do something when experiencing bullying
Eighty-six percent of primary-aged students were at least a little confident to apply what they had learned, compared to 78 percent of secondary-aged students (see Figure 10).
Figure 10: Primary-aged students felt more confident than secondary students to apply what they had learned when experiencing bullying
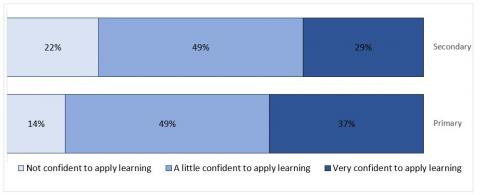
Figure 10 is a graph showing how confident students were to apply what they had learnt about facing bullying, dependant on whether the student was primary or secondary aged. Twenty-two percent of secondary-aged students were not confident to apply what they had learnt. Forty-nine percent were a little confident. Twenty-nine percent were very confident. In comparison, fourteen percent of primary-aged students were not confident to apply what they had learnt. Forty-nine percent were a little confident. Thirty-seven percent were very confident.
Students with more confidence would speak to their teacher
Students who were very confident to apply their learning were more likely to speak to a teacher than students who lacked that confidence (60 percent compared to 34 percent). Twenty-one percent of students who were not confident to apply their learning would tell nobody, compared to only 10 percent of students who were a little confident or very confident to apply their learning.
Putting bullying prevention and response education into practice
Students were asked to indicate whether they had actually used what they had learned to do when they, or other people, were being bullied (as opposed to simply feeling confident to act).
Sixty-five percent of students said they used the knowledge they had learned when experiencing bullying. Thirty-five percent of students did not use their knowledge when they experienced bullying. This was influenced by their level of confidence.
Students who felt more confident were likely to say, or do, what they had learned
Seventy percent of confident students used the knowledge they had learned when they experienced or saw someone else being bullied, compared to only 38 percent of not confident students.
Outcomes of using learning
When students indicated they had used what they had learned to do when experiencing bullying, ERO asked what happened as a result. Students had the following options to choose from:
- the bullying stopped totally
- the bullying did not stop
- the bullying got worse
- the bullying stopped for a bit but then started again
- something else happened, which they could describe.
If the student said they had not used what they had learned, ERO asked them what the main thing was that stopped them saying, or doing, any of the things they had learned. Students had the following options to choose from:
- I did not feel confident enough
- I wasn’t sure what to do
- I felt too afraid
- someone else did something
- other, which they could describe.
For most students who did not use what they had learned it was because of a lack of confidence, or knowledge of what to do
Of the 35 percent of students who did not put into practice what they had learned to do, one-third were not sure what to do when experiencing, or seeing, someone else being bullied. Another 26 percent of students did not feel confident enough to act, and 17 percent felt too afraid. Twenty-two percent of students did not act because someone else intervened.
Only some students who used their knowledge had the bullying stop completely
Of the 65 percent of students who used the knowledge they had learned, around one-third had the bullying completely stop. For the remaining two-thirds of students, the bullying continued. In most cases the bullying stopped for a bit but started again later. Some saw no change as result of using their knowledge, and the bullying did not stop. For a few students, the bullying got worse. Students who were secondary-aged, and/or told someone they were experiencing bullying, were more likely to have the bullying stop. Variables that contributed to the increased likelihood of the bullying stopping when students applied what they had learned were tested using a regression model.
Students who experienced worse outcomes felt less of a sense of belonging to their school
Eighty percent of students who had the bullying completely stop, when they used their knowledge, enjoyed being at school. However, of the students who had the bullying get worse, only 54 percent enjoyed being at school.
Conclusion
It is clear from ERO’s survey that bullying is part of life for too many students in New Zealand schools. Students have different experiences of bullying based on their gender, ethnicity and year level. The bullying is manifested through a range of negative behaviours and with varying levels of frequency. However, every form of bullying damages students’ sense of belonging and enjoyment of school, and can have negative impacts on their health, wellbeing and learning (source: Bullying Free New Zealand)
Almost every school has a bullying prevention and response policy and most students have been taught strategies by their school on what to do if they experience or witness bullying. These are necessary but not sufficient conditions for developing a bullying-free environment.
|
Condition |
Ideally, all of these conditions must be in place when working towards creating a bullying-free environment |
The reality ERO found while conducting this evaluation |
|---|---|---|
|
Knowledge |
Students must have the knowledge of how to respond if they experience or witness bullying |
Eighty-two percent of students had been given strategies at their current school to respond to bullying |
|
Confidence |
Students must have the confidence to respond |
Eighty-five percent of students with knowledge felt confident about the strategies they had learnt |
|
Implementation |
Students must put the strategies into effect |
Seventy percent of confident students actually used the strategies |
|
Outcome |
The bullying ceases for good |
Thirty-six percent of students who used the strategies found the bullying stopped altogether |
|
Monitoring |
The school must monitor the ongoing effectiveness of whatever action is taken to address the bullying, intervening as required. |
Seventy-three percent of schools had satisfactory of better, use of data for monitoring of bullying at their school |
ERO’s findings make it clear that while a large proportion of students have the knowledge they need, fewer have the confidence to act, fewer still take action, and not everything was effective in stopping bullying. In other words, while most students knew what to do when they experienced or witnessed bullying, applying the strategies they had learned did not lead to a full and lasting cessation of the bullying behaviour. Indeed, the most common outcome was that the bullying stopped for a while and then started again.
ERO encourages schools to focus more carefully on each condition – knowledge, confidence, implementation and outcome. Students’ confidence to act and the extent to which they do act will be heavily influenced by the specific context of the bullying, but these can both be improved if students anticipate that the response will successfully eliminate the bullying.
Leaders and teachers in schools can improve the outcomes by ensuring they take appropriate action when bullying is reported and continue to monitor the situation over time. They need to pay particular attention to the most at-risk group, albeit a small one. Gender-diverse students are the most likely to experience bullying and the least likely to report it.
Additionally, as ERO found students were most likely to speak to their parents and whānau when experiencing bullying (69 percent) it is crucial schools work with whānau on an ongoing basis.
ERO’s 2019 report Bullying Prevention and Response in New Zealand Schools, released simultaneously with this report, found many schools were not engaging proactively with parents, but rather notifying them only when serious bullying incidents occurred. The most effective schools had ongoing relationships with parents where they worked together not only in response to bullying, but also building a shared understanding around bullying prevention and the strategies children could use.
Positive partnerships with home and students (giving students a voice and agency) contribute powerfully to the overall school climate and hence the work towards a bullying-free school. This goes beyond what can be captured in a survey. It rests upon a foundation of inclusive, respectful relationships between all members of the school community, where everyone can be trusted to play their part in providing a safe physical and emotional environment, conducive to learning.
Appendix 1: Terms of quantity
The following terms of quantity are used in this report:
|
Terms used |
Percentage |
|---|---|
|
All |
100% |
|
Almost all |
91-99% |
|
Most |
75-90% |
|
Many, Majority |
50-74% |
|
Some |
15-49% |
|
A few |
Less than 15% |
Adapted from Education Scotland
Appendix 2: Questions ERO asked in this survey
Hi,
Your answers will not be shared with your teacher or parents. You do not have to give your name.
Please answer by ticking the boxes. Answer what you can and add any comments you would like to make.
If you are being hurt by bullying behaviour, please talk to an adult you trust.
Your answers are important to us to help schools know how to make them safe and free from bullying.
This survey will take less than 10 minutes.
Thank you for your time.
- What is the name of your school? (Textbox)
- What town or city is your school in or near? (Textbox)
- What is your gender? (Textbox)
- What is your ethnicity?
- New Zealand European/Pākehā
- Māori
- Pacific
- Asian
- Other
- What year of school are you in? (Options between Year 4 - 13)
- How long have you been in the school you go to now? (Options for ‘Less than one year’ and ‘More than one year’)
- Who would you tell if you were being bullied?
- My teacher
- My parents
- My friends
- Other adults at school – like your principal, dean or counsellor
- Nobody
- Is there any other person you would tell if you were being bullied?
- Please tick whether you agree or disagree with the following sentences (agree, disagree or not sure)
- At my school, people accept me for who I am.
- I enjoy being at my school.
- At my school we learn how we should treat each other.
- My teachers behave in the way they would like us to behave.
- At the school you go to now, have any of the things below happened to you? (please tick how often: Never, or hardly ever; 1 or 2 times a month; 1 or 2 times a week; Almost every day)
- I have been called names, put down, or teased in a mean way
- I have been left out by other students or ignored on purpose
- I have been threatened
- I have been hit, pushed, kicked, punched, choked
- I have had personal things (like pens, clothes or money) damaged in a mean way, or stolen
- I have had lies or bad stories spread about me
- I have got nasty messages on my phone or computer (like text or Facebook messages)
- I have been made to do something I didn’t want to do
- Other (please describe)
- At the school I go to now, I learn what to say or do if students are bullying me, or other students? (Options for ‘Yes’ and ‘No’)
- Have you ever been bullied at the school you are going to now? (Options for ‘Yes’ and ‘No’)
- Have you ever seen someone else bullied at the school you are going to now? (Options for ‘Yes’ and ‘No’) If student selects ‘Yes’ for this option, question 13 will be displayed. If the student selects ‘No’ for this option they will be re-directed to question 17
- How confident did you feel to say or do what you had learned when you were bullied or saw someone bullied? (Options for ‘Very confident’, ‘A little confident’ or ‘Not confident’)
- Did you say or do any of the things you learned about when you were bullied or saw someone bullied? (Options for ‘Yes’ and ‘No’) If student selects ‘Yes’ for this option, question 16 will be displayed. If the student selects ‘No’ for this option, question 15 will be displayed.
- What was the main thing that stopped you saying, or doing, any of the things you learned?
- I did not feel confident enough
- I wasn’t sure what to do
- I felt too afraid
- Someone else did something
- Other (please comment)
- What happened when you said, or did, any of the things you learned?
- The bullying stopped totally
- The bullying did not stop
- The bullying got worse
- The bullying stopped for a bit but then started again
- Did anything else happen? (please describe)
- What do you think adults at school should do if you tell them you have been bullied? (Textbox)
- What do you do to make your school a safer place to prevent bullying? (please describe) (Textbox)
- If you had a magic wand, what would you change in your school to stop bullying? (Textbox)
Appendix 3: Schools in sample
Differences between the sample and the national population of schools were not statistically significant.11
Table 1: School type
|
School type |
Number of schools in sample |
Percentage of schools in sample |
National percentage of schools |
|---|---|---|---|
|
Full primary (Year 1-8) |
23 |
35 |
43 |
|
Contributing (Year 1-6) |
26 |
40 |
32 |
|
Intermediate (Year 7-8) |
1 |
1 |
5 |
|
Composite (Year 1-15) |
1 |
1 |
5 |
|
Secondary (Year 7-15) |
4 |
6 |
5 |
|
Secondary (Year 9-15) |
11 |
17 |
10 |
|
Total |
66 |
100 |
100 |
Table 2: Decile
|
Decile group |
Number of schools in sample |
Percentage of schools in sample |
National percentage of schools |
|---|---|---|---|
|
Low decile |
21 |
32 |
28 |
|
Mid decile |
19 |
28 |
40 |
|
High decile |
26 |
40 |
32 |
|
Total |
66 |
100 |
100 |
Table 3: Location
|
Urban/rural area |
Number of schools in sample |
Percentage of schools in sample |
National percentage of schools |
|---|---|---|---|
|
Main urban area |
44 |
67 |
55 |
|
Secondary urban area |
3 |
5 |
6 |
|
Minor urban area |
4 |
6 |
12 |
|
Rural area |
15 |
22 |
27 |
|
Total |
66 |
100 |
100 |
Table 4: School size
|
School roll |
Number of schools in sample |
Percentage of schools in sample |
National percentage of schools |
|---|---|---|---|
|
Very small |
3 |
5 |
8 |
|
Small |
13 |
20 |
22 |
|
Medium |
23 |
35 |
37 |
|
Large |
16 |
23 |
21 |
|
Very large |
11 |
17 |
12 |
|
Total |
66 |
100 |
100 |
Explanatory notes
The differences between observed and expected values in for tables in Appendix 1 and 2 were tested using a Chi-square test.
The national percentage of schools for type, decile and location is as at February 2019.
Deciles 1-3 are low decile schools; deciles 4-7 are mid decile schools; deciles 8-10 are high decile schools.
Main urban areas have a population greater than 30,000; secondary urban areas have a population between 10,000 and 29,999; minor urban areas have a population between 1000 and 9,999; and rural areas have a population less than 1000.
Roll sizes for full primary, contributing and intermediate schools are: very small (1-30); small (31-100); medium (101-300); large (301-500) and very large (more than 500). Roll sizes for secondary and composite schools are: very small (1-100); small (101-400); medium (401-800); large (801-1500) and very large (more than 1500).
The national percentage of schools for size is as at July 2018, which was when the survey was conducted.
Appendix 4: Students in sample
Female students are over-represented in the sample, compared to the national percentage of student population. The ‘other’ ethnicity category was over-represented in this sample, though this was due to many ethnicities students entered not being identifiable. Year 7 and 8 students were under-represented in the sample, and Year 10 to 13 students were over-represented.
In the tables below, non-response has been excluded from the sample totals on a question by question basis.
Table 1: Student gender
|
Student gender |
Number of students in sample |
Percentage of students in sample |
National percentage of students (as at July 2018) |
|---|---|---|---|
|
Female |
6433 |
60 |
49 |
|
Male |
4362 |
40 |
51 |
|
Gender-diverse |
60 |
<1 |
Not reported |
|
Total |
10855 |
100 |
100 |
Table 2: Student ethnicity
|
Student ethnicity |
Number of students in sample |
Percentage of students in sample |
National percentage of students |
|---|---|---|---|
|
New Zealand European/Pākehā |
4779 |
48 |
50 |
|
Māori |
1717 |
17 |
25 |
|
Pacific |
994 |
10 |
10 |
|
Asian |
1137 |
12 |
12 |
|
Other/cannot be identified |
1259 |
13 |
3 |
|
Total |
9886 |
100 |
100 |
Table 3: Year level of students
|
Year level |
Number of students in sample |
Percentage of students in sample |
National percentage of students (Y4-13) |
|---|---|---|---|
|
Year 4 |
1083 |
10 |
11 |
|
Year 5 |
1226 |
11 |
11 |
|
Year 6 |
1284 |
12 |
11 |
|
Year 7 |
748 |
7 |
11 |
|
Year 8 |
713 |
6 |
10 |
|
Year 9 |
1113 |
10 |
10 |
|
Year 10 |
1307 |
12 |
10 |
|
Year 11 |
1143 |
10 |
9 |
|
Year 12 |
1276 |
12 |
9 |
|
Year 13 |
1140 |
10 |
8 |
|
Total |
11033 |
100 |
100 |
Appendix 5: Student survey responses
Percentages are of the number of students who responded to each question, and not the overall sample. These percentages have not been weighted. The percentages for Question 7 do not sum to 100, as respondents could choose multiple options.
Q6: How long have you been at your current school?
|
Length of time |
Frequency |
Percent (%) |
|---|---|---|
|
Less than one year |
1995 |
18 |
|
More than one year |
8945 |
82 |
|
Total |
10940 |
100 |
Q7: Who did you tell about bullying?
|
Who |
Frequency |
Percent(%) |
|---|---|---|
|
Teacher |
5279 |
48 |
|
Parents |
7567 |
68 |
|
Friends |
6586 |
59 |
|
Other adults at school |
3821 |
34 |
|
Nobody |
1203 |
11 |
Q8a: I am accepted for who I am …
|
Response |
Frequency |
Percent (%) |
|---|---|---|
|
Agree |
7284 |
69 |
|
Disagree |
717 |
7 |
|
Not sure |
2593 |
24 |
|
Total |
10594 |
100 |
Q8b: I enjoy being at school …
|
Response |
Frequency |
Percent(%) |
|---|---|---|
|
Agree |
7927 |
75 |
|
Disagree |
1079 |
10 |
|
Not sure |
1545 |
15 |
|
Total |
10551 |
100 |
Q8c: We learn how to treat each other …
|
Response |
Frequency |
Percent (%) |
|---|---|---|
|
Agree |
8167 |
77 |
|
Disagree |
919 |
9 |
|
Not sure |
1435 |
14 |
|
Total |
10521 |
100 |
Q8d: Teachers behave like we should behave …
|
Response |
Frequency |
Percent (%) |
|---|---|---|
|
Agree |
7657 |
72 |
|
Disagree |
942 |
9 |
|
Not sure |
1969 |
19 |
|
Total |
10568 |
100 |
Q9a: How often have you been called names/put down/teased in a mean way?
|
Response |
Frequency |
Percent (%) |
|---|---|---|
|
Almost every day |
736 |
7 |
|
1 or 2 times a week |
985 |
10 |
|
1 or 2 times a month |
2011 |
19 |
|
Never, or hardly ever |
6551 |
64 |
|
Total |
10283 |
100 |
Q9b: How often have you been left out by other students or ignored on purpose?
|
Response |
Frequency |
Percent (%) |
|---|---|---|
|
Almost every day |
573 |
6 |
|
1 or 2 times a week |
959 |
9 |
|
1 or 2 times a month |
2326 |
23 |
|
Never, or hardly ever |
6412 |
62 |
|
Total |
10270 |
100 |
Q9c: How often have you been threatened?
|
Response |
Frequency |
Percent (%) |
|---|---|---|
|
Almost every day |
325 |
3 |
|
1 or 2 times a week |
368 |
4 |
|
1 or 2 times a month |
1024 |
10 |
|
Never, or hardly ever |
8366 |
83 |
|
Total |
10083 |
100 |
Q9d: How often have you been assaulted (hit, pushed, kicked, punched, choked)?
|
Response |
Frequency |
Percent (%) |
|---|---|---|
|
Almost every day |
377 |
4 |
|
1 or 2 times a week |
409 |
4 |
|
1 or 2 times a month |
1314 |
13 |
|
Never, or hardly ever |
8148 |
79 |
|
Total |
10248 |
100 |
Q9e: How often have you had personal things damaged or stolen?
|
Response |
Frequency |
Percent (%) |
|---|---|---|
|
Almost every day |
258 |
3 |
|
1 or 2 times a week |
375 |
4 |
|
1 or 2 times a month |
1470 |
14 |
|
Never, or hardly ever |
8156 |
79 |
|
Total |
10259 |
100 |
Q9f: How often have you had lies or bad stories spread about you?
|
Response |
Frequency |
Percent (%) |
|---|---|---|
|
Almost every day |
400 |
4 |
|
1 or 2 times a week |
555 |
5 |
|
1 or 2 times a month |
2004 |
20 |
|
Never, or hardly ever |
7268 |
71 |
|
Total |
10227 |
100 |
Q9g: How often have you had nasty messages left on your phone or computer?
|
Response |
Frequency |
Percent (%) |
|---|---|---|
|
Almost every day |
214 |
2 |
|
1 or 2 times a week |
211 |
2 |
|
1 or 2 times a month |
772 |
8 |
|
Never, or hardly ever |
9023 |
88 |
|
Total |
10220 |
100 |
Q9h: How often have you been made to do something you didn’t want to do?
|
Response |
Frequency |
Percent (%) |
|---|---|---|
|
Almost every day |
357 |
4 |
|
1 or 2 times a week |
406 |
4 |
|
1 or 2 times a month |
1471 |
14 |
|
Never, or hardly ever |
7986 |
78 |
|
Total |
10220 |
100 |
Q9i: Have you experienced other bullying behaviours (besides those in Q9a to Q9h)?*
|
Response |
Frequency |
Percent (%) |
|---|---|---|
|
Other behaviour indicated in text-box |
547 |
5 |
*Responses here varied widely and in the end did not form part of ERO’s analysis and reporting.
Q10: At the school you go to now, have you learnt what to say or do if you or other students are being bullied.?
|
Response |
Frequency |
Percent (%) |
|---|---|---|
|
Yes |
8252 |
82 |
|
No |
1871 |
18 |
|
Total |
10123 |
100 |
Q11: Have you ever been bullied at the school you are going to now?
|
Response |
Frequency |
Percent (%) |
|---|---|---|
|
Yes |
3711 |
37 |
|
No |
6413 |
63 |
|
Total |
10124 |
100 |
Q12: Have you ever seen someone else bullied at the school you are going to now?
|
Response |
Frequency |
Percent (%) |
|---|---|---|
|
Yes |
5749 |
57 |
|
No |
4369 |
43 |
|
Total |
10118 |
100 |
Q13: How confident are you to say or do something when you are bullied?
|
Response |
Frequency |
Percent (%) |
|---|---|---|
|
Very confident |
2067 |
32 |
|
A little confident |
3163 |
49 |
|
Not confident |
1207 |
19 |
|
Total |
6437 |
100 |
Q14: Did you say or do anything if you were bullied or saw bullying?
|
Response |
Frequency |
Percent (%) |
|---|---|---|
|
Yes |
4074 |
64 |
|
No |
2339 |
36 |
|
Total |
6413 |
100 |
Q15: If your answer to Q14 was No, what stopped you saying or doing something?
|
Response |
Frequency |
Percent (%) |
|---|---|---|
|
I did not feel confident enough |
551 |
28 |
|
I wasn’t sure what to do |
636 |
32 |
|
I felt too afraid |
364 |
19 |
|
Someone else did something |
415 |
21 |
|
Total |
1966 |
100 |
Q16: If your answer to Q14 was Yes, what happened when you said or did something?
|
Response |
Frequency |
Percent (%) |
|---|---|---|
|
The bullying stopped |
1382 |
35 |
|
The bullying did not stop |
608 |
16 |
|
The bullying got worse |
235 |
6 |
|
Stopped for a bit, started again |
1658 |
43 |
|
Total |
3883 |
100 |
Publication Information and Copyright
Bullying Prevention and Response: Student Voice
Published 2019
© Crown Copyright
ISBN 978-0-478-43893-2
Except for the Education Review Office’s logo used throughout this report, this copyright work is licensed under Creative Commons Attribution 3.0 New Zealand licence. In essence, you are free to copy, distribute and adapt the work, as long as you attribute the work to the Education Review Office and abide by the other licence terms. In your attribution, use the wording ‘Education Review Office’, not the Education Review Office logo or the New Zealand Government logo.